


ตำนานแห่งทีม InstaSpot!
ที่สุด! คุณคิดว่าอะไรคือการทำให้รู้สึกฮึกเหิมกันละ? แต่พวกเราควรจะเรียกคนที่กลายมาเป็นชาวเอเชียคนแรกที่คว้าแชมป์หมากรุกระดับโลกรุ่นเยาวชนอายุ 18 ปี และยังกลายมาเป็นแกรนด์มาสเตอร์ชาวอินเดียคนแรกด้วยอายุ 19ปีเท่านั้น? นั้นเป็นจุดเริ่มต้นของเส้นทางสู่การเป็นแชมป์โลกสำหรับคุณ Viswanathan Anand คนที่กลายมาเป็นส่วนหนึ่งในหน้าประวติศาสตร์หมากรุกไปตลาดกาล ตอนนี้ก็มีอีกตำนานมาอยู่ในทีม InstaSpot แล้ว!


Borussia เป็นหนึ่งในสโมสรฟุตบอลขึ้นชื่อในประเทศเยอรมนี ที่ได้พิสูจน์ให้กับเหล่าแฟนๆเห็นแล้วถึงจิตวิญญาณของการแข่งขัน และการขึ้นมาสู่จุดสูงสุด เพื่อจะมุ่งหน้าสู่ความสำเร็จ การเทรดเองก็เหมือนกับการเล่นกีฬาอย่างมืออาชีพในการแข่งขัน โดยต้องมีความมั่นใจและการไม่หยุดนิ่ง เพื่อที่จะได้ "ผ่าน" จากสโมสร Borussia FC และขึ้นมาอยู่ในอันดับต้นไปพร้อมกับ InstaSpot!

The USD/JPY pair dropped a little in the short term but the bias remains bullish. It's trading at 140.28 at the time of writing far below 140.91 today's high. Temporary retreats could bring us new longs.
Fundamentally, the US and Japanese economic data came in mixed on Friday. In the short term, the rate could test and retest the near-term support levels before jumping higher. Still, it remains to see how it reacts tomorrow. The Japanese Unemployment Claims could drop from 2.8% to 2.7%, while the US CB Consumer Confidence is expected at 99.1 points versus 101.3 points estimated.
The US data could be decisive during the week. The NFP, Average Hourly Earnings, Unemployment Rate, ADP Non-Farm Employment Change, ISM Manufacturing PMI, and JOLTS Job Openings could really shake the markets.
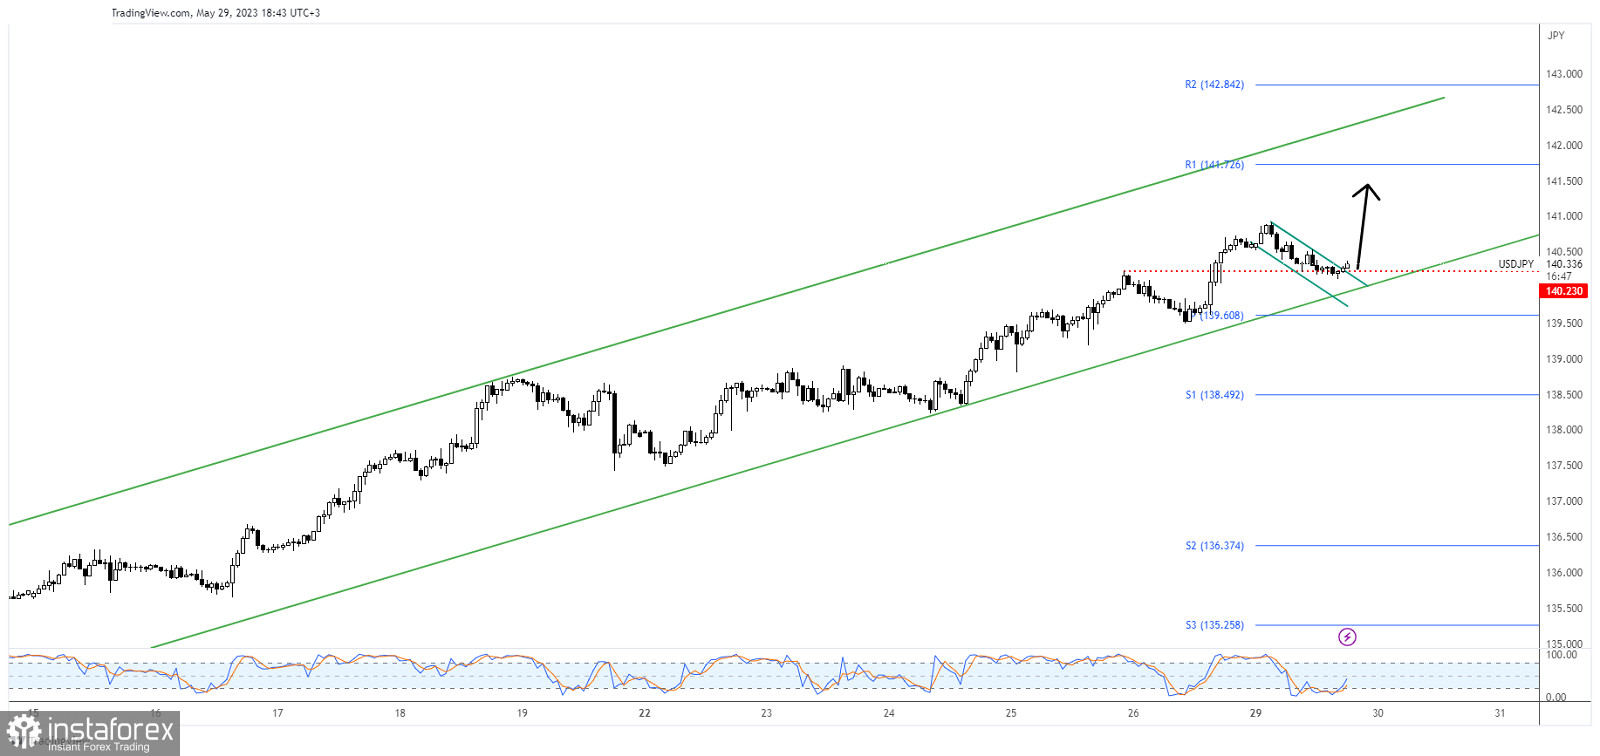
As you can see on the H1 chart, USD/JPY dropped a little within a minor down channel. Now, it has found support on the 140.23 former high and it tries to come back higher. The bias remains bullish as long as it stays above the uptrend line.
Technically, the minor retreat represented a flag pattern which is seen as a bullish formation. After the previous rally, a minor retreat was natural.
Escaping from the minor flag may announce a new bullish momentum. Testing and retesting 140.23, consolidation above the immediate support levels should bring new longs. False breakdowns below 140.23 and under the lower median line (lml) could represent buying signals. The weekly R1 (141.72) represents an upside target if the rate continues to grow.
*บทวิเคราะห์ในตลาดที่มีการโพสต์ตรงนี้ เพียงเพื่อทำให้คุณทราบถึงข้อมูล ไม่ได้เป็นการเจาะจงถึงขั้นตอนให้คุณทำการซื้อขายตาม
บทวิเคราะห์ของทาง InstaSpot จะทำให้คุณทราบถึงแนวโน้มของตลาด! ในการที่เป็นลูกค้าของทาง InstaSpot นั้นคุณจะได้รับการบริการเพื่อการซื้อขายอย่างเต็มประสิทธิภาพอย่างมากมาย


