


Tim kami memiliki lebih dari 7.000.000 trader!
Setiap harinya kami bekerja sama untuk meningkatkan trading. Kami memperoleh hasil tinggi dan terus bergerak maju.
Pengakuan dari jutaan trader diseluruh dunia merupakan apresiasi terbaik dari kerja kami! Anda membuat pilihan anda dan kami akan melakukan semua yang dibutuhkan untuk memenuhi ekspektasi anda!
We are a great team together!
InstaSpot. Bangga bekerja bersama anda!


Seorang Aktor, juara 6 turnamen UFC dan pahlawan sesungguhnya!
Pria yang berhasil. Pria yang berusaha keras.
Rahasia dibalik kesuksesan Taktarov adalah pergerakan konstan menuju target.
Tunjukkan seluruh sisi dari bakat anda!
Temukan, coba, gagal - namun jangan pernah berhenti!
InstaSpot. Cerita sukses anda dimulai disini!

The USD/JPY pair dropped a little in the short term but the bias remains bullish. It's trading at 140.28 at the time of writing far below 140.91 today's high. Temporary retreats could bring us new longs.
Fundamentally, the US and Japanese economic data came in mixed on Friday. In the short term, the rate could test and retest the near-term support levels before jumping higher. Still, it remains to see how it reacts tomorrow. The Japanese Unemployment Claims could drop from 2.8% to 2.7%, while the US CB Consumer Confidence is expected at 99.1 points versus 101.3 points estimated.
The US data could be decisive during the week. The NFP, Average Hourly Earnings, Unemployment Rate, ADP Non-Farm Employment Change, ISM Manufacturing PMI, and JOLTS Job Openings could really shake the markets.
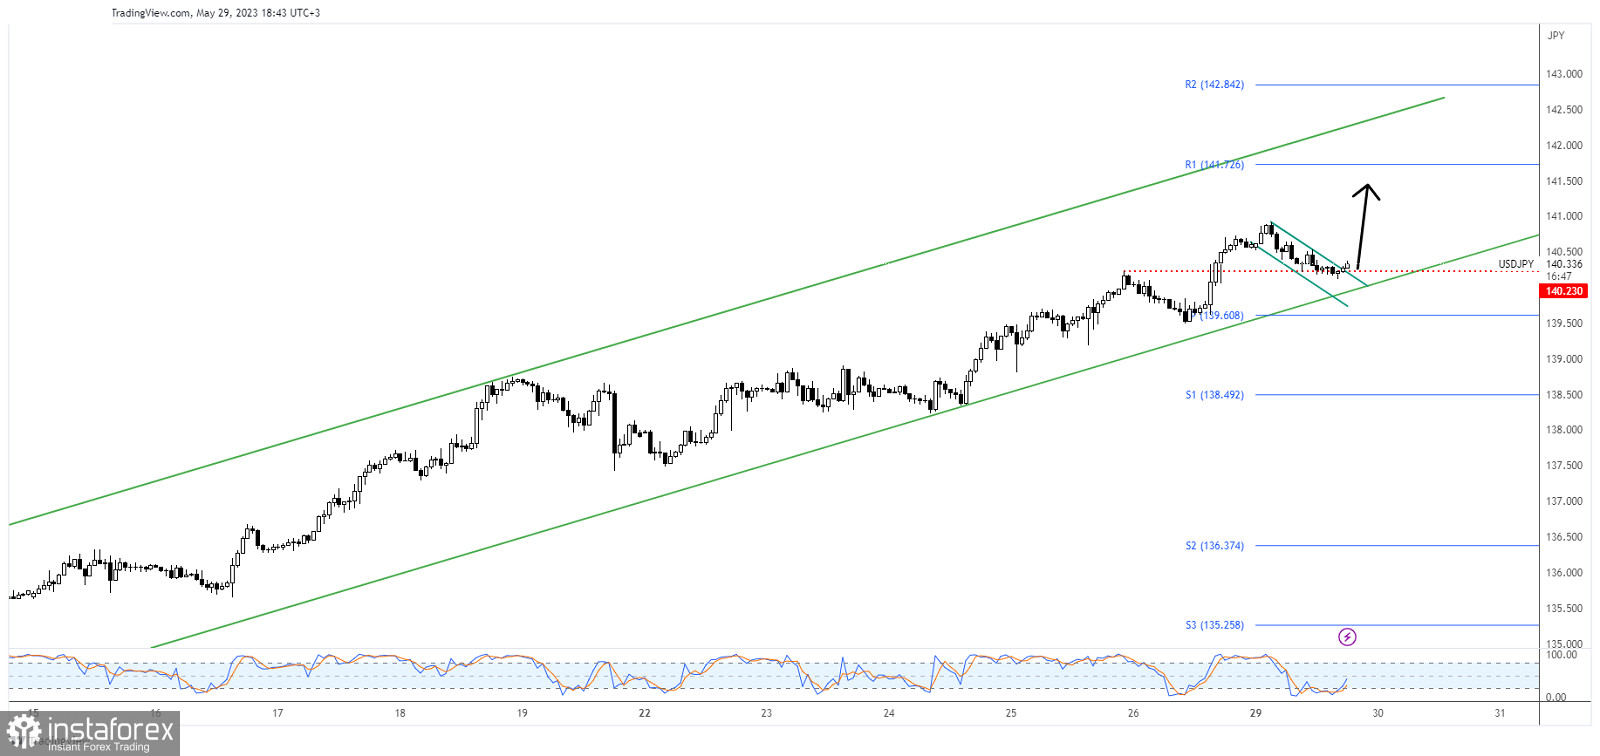
As you can see on the H1 chart, USD/JPY dropped a little within a minor down channel. Now, it has found support on the 140.23 former high and it tries to come back higher. The bias remains bullish as long as it stays above the uptrend line.
Technically, the minor retreat represented a flag pattern which is seen as a bullish formation. After the previous rally, a minor retreat was natural.
Escaping from the minor flag may announce a new bullish momentum. Testing and retesting 140.23, consolidation above the immediate support levels should bring new longs. False breakdowns below 140.23 and under the lower median line (lml) could represent buying signals. The weekly R1 (141.72) represents an upside target if the rate continues to grow.
*Analisis pasar yang diposting disini dimaksudkan untuk meningkatkan pengetahuan Anda namun tidak untuk memberi instruksi trading.
Tinjauan analitis InstaSpot akan membuat Anda menyadari sepenuhnya tren pasar! Sebagai klien InstaSpot, Anda dilengkapi dengan sejumlah besar layanan gratis untuk trading yang efisien.


