


ہمارے ٹیم میں 7000000 سے ذائد تاجران شامل ہیں
ہم تجارت کی بہتری کے لئے ہر روز اکھٹے کام کرتے ہیں اور بہترین نتائج حاصل کرتے ہوئے آگے کی جانب بڑھتے ہیں
دُنیا بھر سے سے لاکھوں ہمارے بہترین کام کو سند عطاء کرتے ہیں آپ اپنا انتحاب کریں باقی ہم آپ کی توقعات پر پورا اترنے کے لئے اپنی بہترین کوشش کریں گے
ہم مل کر ایک بہترین ٹیم بناتے ہیں
انسٹا فاریکس آپ سے کام کرتے ہوئے فخر محسوس کرتا ہے


ایکٹر - یو سی ایف 6 ٹورنامنٹ چیمپین اور واقعی ہیرو
ایک فرد کے جس نے اپنا آپ منوایا ہے وہ فرد کہ جو ہماری راہ پر چلا ہے.
ٹکٹا روو کی کامیابی کا راز یہ ہے کہ وہ اپنے اہداف کی جانب مسلسل بڑھتا رہتا ہے
اپنے ہنر یا ٹیلنٹ کے تمام پہلو آشکار کررہے ہیں
پہچانیں ، کوشش کریں ، ناکام ہوں لیکن کبھی نہ رُکیں
انسٹا فاریکس آپ کی کامیابی کی کہاں یہاں سے شروع ہوتی ہے

EUR/USD
Analysis:
The direction of the trend sets the course of the rising wave from March 23. Quotes of the European currency are located in the reversal zone of a large TF. The price has reached the next resistance, which may become the starting point of correction. A reversal pattern has been formed on small-scale charts since yesterday.
Forecast:
In the coming day, it is expected to complete the reversal and start a counter decline. When changing the direction, a short-term puncture of the upper limit of the resistance is not excluded. Then you can wait for a second attempt to pressure the resistance.
Potential reversal zones
Resistance:
- 1.1960/1.1990
Support:
- 1.1890/1.1860
Recommendations:
Trading the euro in the market today can be risky. When buying, you should take into account the limited potential of the expected rise. You should resume trading only after clear reversal signals appear.

USD/JPY
Analysis:
The direction of the short-term trend of the Japanese yen since June 5 is set by a downward wave. An incorrect correction has been nearing completion in its structure since the beginning of August. The downward section from August 12 has enough potential to start a new wave in the direction of the main trend. At the current moment, the price has reached the intermediate support.
Forecast:
In the next trading session, the most probable is a flat mood of the price movement, with an upward vector. The maximum expected range of price growth is shown by the resistance zone. By the end of the day, you can expect a return to the downward rate.
Potential reversal zones
Resistance:
- 105.90/106.20
Support:
- 105.30/105.20
- 104.50/104.20
Recommendations:
Trading the yen on the market is not recommended until the bullish pullback is complete. After completion, you should look for the instrument's sell signals at its end.
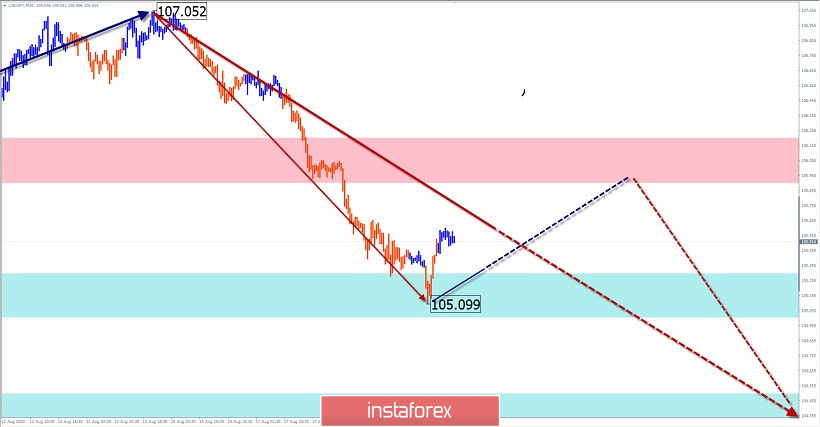
Explanation: In the simplified wave analysis (UVA), waves consist of 3 parts (A-B-C). The last incomplete wave is analyzed. The solid background of arrows shows the formed structure, and the dotted ones show the expected movements.
Note: The wave algorithm does not take into account the duration of the tool movements in time!
*تعینات کیا مراد ہے مارکیٹ کے تجزیات یہاں ارسال کیے جاتے ہیں جس کا مقصد آپ کی بیداری بڑھانا ہے، لیکن تجارت کرنے کے لئے ہدایات دینا نہیں.
InstaSpot analytical reviews will make you fully aware of market trends! Being an InstaSpot client, you are provided with a large number of free services for efficient trading.


