


Legenda tim InstaSpot!
Legenda! Anda pikir legenda adalah retorika yang bombastis? Lalu, bagaimana menyebut seorang pria, seorang Asia pertama yang memenangkan kejuaraan catur dunia junior pada usia 18 tahun, dan yang menjadi Grandmaster India pertama pada usia 19 tahun? Itulah awal perjalanan yang sulit dalam meraih gelar Juara Dunia bagi Viswanathan Anand, pria yang menjadi bagian dari sejarah catur untuk selamanya. Sekarang, satu lagi legenda masuk ke dalam tim InstaSpot!


Borussia merupakan salah satu klub sepakbola paling terkenal di Jerman, yang telah berulang kali membuktikan pada para penggemarnya: semangat kompetisi dan kepemimpinan pasti akan mengarah pada kesuksesan. Lakukan trading dengan cara yang sama seperti para profesional olahraga: percaya diri dan aktif. Gunakan "kunci" dari Borussia FC dan jadilah yang terdepan bersama InstaSpot!

EUR/USD
Analysis:
The direction of the trend sets the course of the rising wave from March 23. Quotes of the European currency are located in the reversal zone of a large TF. The price has reached the next resistance, which may become the starting point of correction. A reversal pattern has been formed on small-scale charts since yesterday.
Forecast:
In the coming day, it is expected to complete the reversal and start a counter decline. When changing the direction, a short-term puncture of the upper limit of the resistance is not excluded. Then you can wait for a second attempt to pressure the resistance.
Potential reversal zones
Resistance:
- 1.1960/1.1990
Support:
- 1.1890/1.1860
Recommendations:
Trading the euro in the market today can be risky. When buying, you should take into account the limited potential of the expected rise. You should resume trading only after clear reversal signals appear.

USD/JPY
Analysis:
The direction of the short-term trend of the Japanese yen since June 5 is set by a downward wave. An incorrect correction has been nearing completion in its structure since the beginning of August. The downward section from August 12 has enough potential to start a new wave in the direction of the main trend. At the current moment, the price has reached the intermediate support.
Forecast:
In the next trading session, the most probable is a flat mood of the price movement, with an upward vector. The maximum expected range of price growth is shown by the resistance zone. By the end of the day, you can expect a return to the downward rate.
Potential reversal zones
Resistance:
- 105.90/106.20
Support:
- 105.30/105.20
- 104.50/104.20
Recommendations:
Trading the yen on the market is not recommended until the bullish pullback is complete. After completion, you should look for the instrument's sell signals at its end.
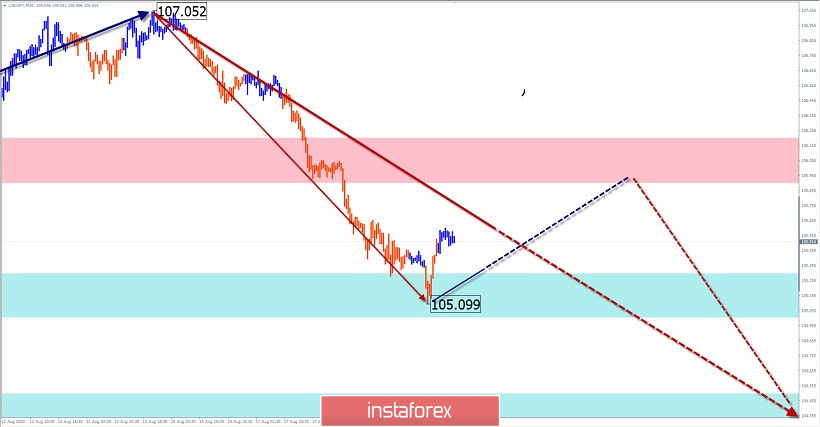
Explanation: In the simplified wave analysis (UVA), waves consist of 3 parts (A-B-C). The last incomplete wave is analyzed. The solid background of arrows shows the formed structure, and the dotted ones show the expected movements.
Note: The wave algorithm does not take into account the duration of the tool movements in time!
*Analisis pasar yang diposting disini dimaksudkan untuk meningkatkan pengetahuan Anda namun tidak untuk memberi instruksi trading.
Tinjauan analitis InstaSpot akan membuat Anda menyadari sepenuhnya tren pasar! Sebagai klien InstaSpot, Anda dilengkapi dengan sejumlah besar layanan gratis untuk trading yang efisien.


