


我们的团队有超过700万的操盘手!
我们每天都在一起努力改善交易。我们得到了很高的成绩,并继续前进。
世界各地数以百万计的操盘手的认可是我们工作的最大赞赏! 您做出了您的选择,我们将尽一切努力来满足您的期望!
我们是一个共同的伟大团队!
InstaSpot. 自豪地为您工作!


EUR/USD
Analysis:
The direction of the trend sets the course of the rising wave from March 23. Quotes of the European currency are located in the reversal zone of a large TF. The price has reached the next resistance, which may become the starting point of correction. A reversal pattern has been formed on small-scale charts since yesterday.
Forecast:
In the coming day, it is expected to complete the reversal and start a counter decline. When changing the direction, a short-term puncture of the upper limit of the resistance is not excluded. Then you can wait for a second attempt to pressure the resistance.
Potential reversal zones
Resistance:
- 1.1960/1.1990
Support:
- 1.1890/1.1860
Recommendations:
Trading the euro in the market today can be risky. When buying, you should take into account the limited potential of the expected rise. You should resume trading only after clear reversal signals appear.

USD/JPY
Analysis:
The direction of the short-term trend of the Japanese yen since June 5 is set by a downward wave. An incorrect correction has been nearing completion in its structure since the beginning of August. The downward section from August 12 has enough potential to start a new wave in the direction of the main trend. At the current moment, the price has reached the intermediate support.
Forecast:
In the next trading session, the most probable is a flat mood of the price movement, with an upward vector. The maximum expected range of price growth is shown by the resistance zone. By the end of the day, you can expect a return to the downward rate.
Potential reversal zones
Resistance:
- 105.90/106.20
Support:
- 105.30/105.20
- 104.50/104.20
Recommendations:
Trading the yen on the market is not recommended until the bullish pullback is complete. After completion, you should look for the instrument's sell signals at its end.
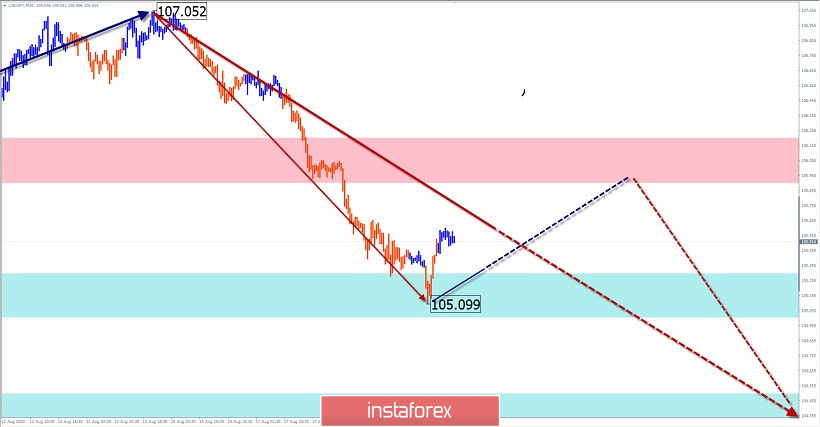
Explanation: In the simplified wave analysis (UVA), waves consist of 3 parts (A-B-C). The last incomplete wave is analyzed. The solid background of arrows shows the formed structure, and the dotted ones show the expected movements.
Note: The wave algorithm does not take into account the duration of the tool movements in time!
*这里的市场分析是为了增加您对市场的了解,而不是给出交易的指示。
InstaSpot分析评论将让您充分了解市场趋势! 作为InstaSpot的客户,您将获得大量的免费服务以实现有效的交易。


