


Legenda dalam pasukan InstaSpot!
Legenda! Anda fikir ia adalah satu retorik yang besar? Tetapi bagaimana untuk kita memanggil seorang lelaki, yang telah menjadi pemain Asia pertama yang memenangi kejohanan catur dunia junior pada usia 18 tahun dan menjadi Grandmaster India pertama pada usia 19 tahun? Itulah permulaan yang sukar untuk merangkul gelaran Juara Dunia untuk Viswanathan Anand, seorang juara yang telah menjadi sebahagian daripada sejarah catur. Kini satu lagi legenda dalam pasukan InstaSpot!


Borussia adalah salah satu kelab bola sepak paling terkemuka di Jerman, yang telah berulang kali membuktikan kepada peminatnya: semangat persaingan dan kepemimpinan pasti akan membawa kepada kejayaan. Berdagang dengan cara yang sama seperti atlet sukan profesional beraksi menentang lawan: yakin dan aktif. Simpan "hantaran" dari Borussia FC dan menjadi pedagang hebat dengan InstaSpot!

Trend analysis (Fig. 1).
The GBP/USD currency pair may move upward from the level of 1.2747 (closing of Friday's daily candlestick) to 1.2790, the historical resistance level (blue dotted line). From this level, a continued upward movement is possible to the upper fractal at 1.2828 (daily candle from 28/12/2023).
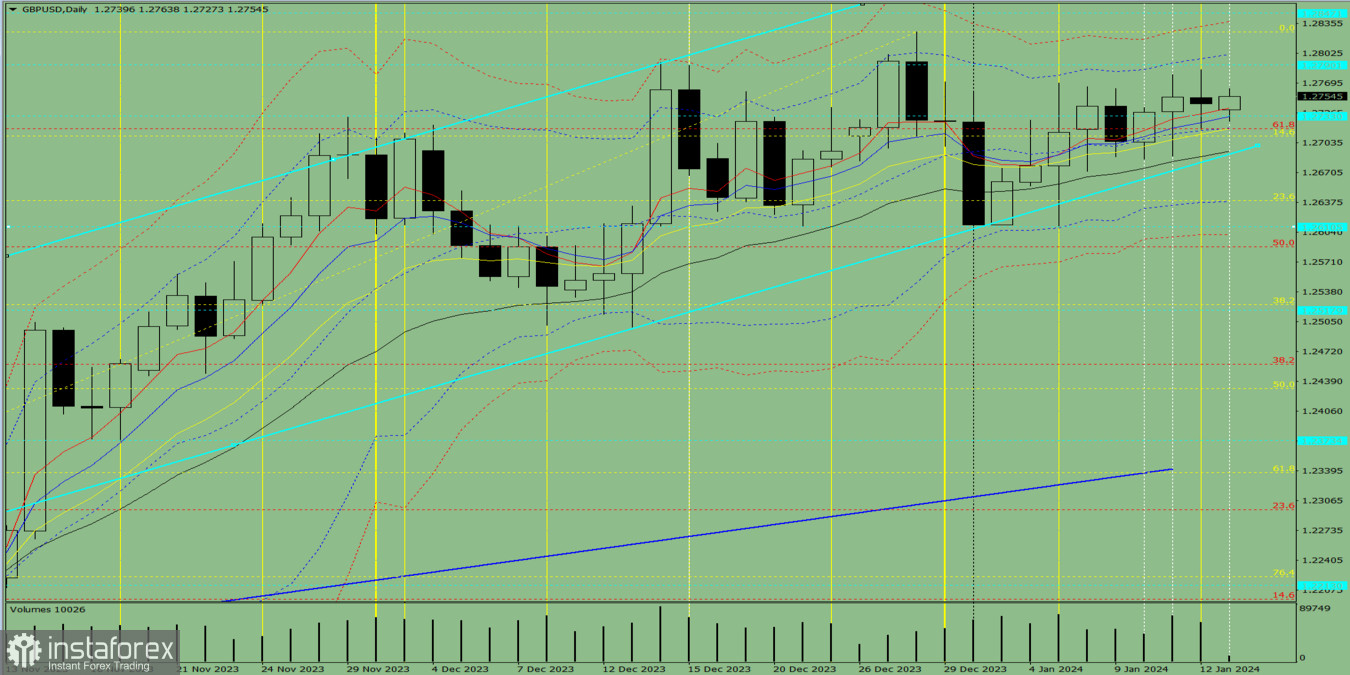
Fig. 1 (daily chart).
Comprehensive analysis:
General conclusion: Today, the price may move upward from the level of 1.2747 (closing of Friday's daily candlestick) to 1.2790, the historical resistance level (blue dotted line). From this level, a continued upward movement is possible to the upper fractal at 1.2828 (daily candle from 28/12/2023).
Alternatively, the price may move upward from level of 1.2747 (closing of Friday's daily candlestick) to 1.2790, the historical resistance level (blue dotted line). Then, the price may decline with the target at 1.2733, the historical support level (blue dotted line).
* Analisis pasaran yang disiarkan di sini adalah bertujuan untuk meningkatkan kesedaran anda, tetapi tidak untuk memberi arahan untuk membuat perdagangan.
Kajian analisis InstaSpot akan membuat anda mengetahui sepenuhnya aliran pasaran! Sebagai pelanggan InstaSpot, anda disediakan sejumlah besar perkhidmatan percuma untuk dagangan yang cekap.


