


हमारी टीम के पास 7,000,000 से अधिक ट्रेडर हैं!
प्रतिदिन हम ट्रेडिंग को बेहतर बनाने के लिए एक साथ काम करते हैं। हम उच्च परिणाम प्राप्त कर रहे हैं और आगे की ओर बढ़ रहे हैं।
दुनियाभर के लाखों लोगों द्वारा हमारे काम को पहचानना, हमारे काम की सबसे अच्छी सराहना है! आपने आपनी पसंद बनाई है और हम आपकी अपेक्षाओं को पूरा करने के लिए हर संभव प्रयास करेंगे!
हम एक साथ एक अच्छी टीम हैं!
इंस्टाफॉरेक्स को इस बात का गर्व है कि वह आपके लिए काम कर रहा है!


एक्टर, यूएफसी 6 टूर्नामेंट का विजेता और एक सच्चा हीरो!
वह आदमी, जिसने अपनी मेहनत से सब किया है। वह आदमी, जो हमारे रास्तों पर चलता है.
टैक्टारोव की सफलता का राज लक्ष्य की ओर लगातर अग्रसर रहना है।
अपनी प्रतिभा के सभी पक्षों को प्रकट करें!
खोज करें, कोशिश करें, विफल हो-लेकिन कभी न रूकें!
इंस्टाफॉरेक्स- हमारी सफलताओं की कहानी यहाँ से शुरू होती है!

Trend analysis (Fig. 1).
The GBP/USD currency pair may move upward from the level of 1.2747 (closing of Friday's daily candlestick) to 1.2790, the historical resistance level (blue dotted line). From this level, a continued upward movement is possible to the upper fractal at 1.2828 (daily candle from 28/12/2023).
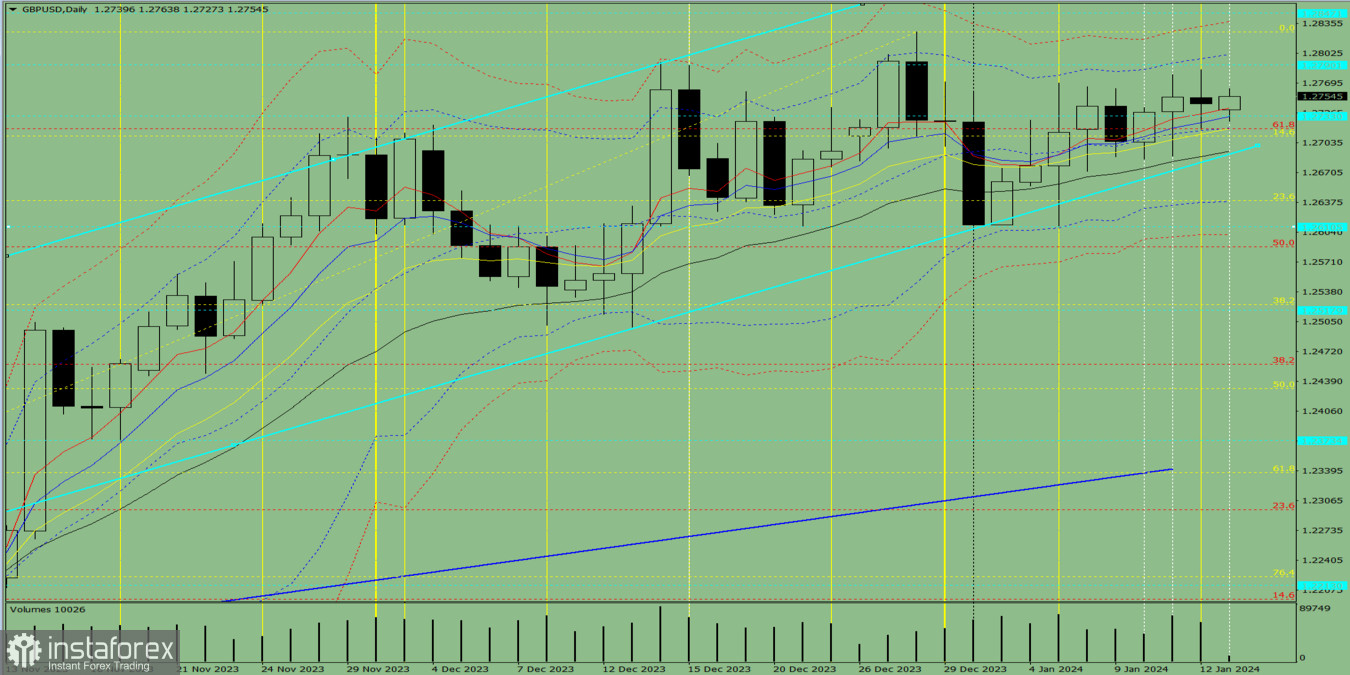
Fig. 1 (daily chart).
Comprehensive analysis:
General conclusion: Today, the price may move upward from the level of 1.2747 (closing of Friday's daily candlestick) to 1.2790, the historical resistance level (blue dotted line). From this level, a continued upward movement is possible to the upper fractal at 1.2828 (daily candle from 28/12/2023).
Alternatively, the price may move upward from level of 1.2747 (closing of Friday's daily candlestick) to 1.2790, the historical resistance level (blue dotted line). Then, the price may decline with the target at 1.2733, the historical support level (blue dotted line).
*यहां पर लिखा गया बाजार विश्लेषण आपकी जागरूकता बढ़ाने के लिए किया है, लेकिन व्यापार करने के लिए निर्देश देने के लिए नहीं |
InstaSpot analytical reviews will make you fully aware of market trends! Being an InstaSpot client, you are provided with a large number of free services for efficient trading.


