


Huyền thoại trong nhóm InstaSpot!
Huyền thoại! Bạn nghĩ rằng đó là lời nói khoa trương? Nhưng chúng ta nên gọi một người đàn ông như thế nào, người đã trở thành người châu Á đầu tiên giành chức vô địch cờ vua thế giới lứa tuổi thiếu niên năm 18 tuổi và người trở thành Đại kiện tướng Ấn Độ đầu tiên năm 19 tuổi? Đó là khởi đầu cho con đường khó khăn đến danh hiệu Vô địch Thế giới của Viswanathan Anand, người đàn ông đã trở thành một phần của lịch sử cờ vua mãi mãi. Giờ đây, một huyền thoại nữa trong nhóm InstaSpot!


Borussia là một trong những câu lạc bộ bóng đá danh giá nhất nước Đức, đã nhiều lần chứng minh cho người hâm mộ thấy: tinh thần thi đấu và sự lãnh đạo chắc chắn sẽ dẫn đến thành công. Giao dịch theo cách mà các chuyên gia thể thao chơi trò chơi: tự tin và chủ động. Giữ một "đường chuyền" từ Borussia FC và dẫn đầu với InstaSpot!
Trend analysis (Fig. 1).
The GBP/USD currency pair may move upward from the level of 1.2747 (closing of Friday's daily candlestick) to 1.2790, the historical resistance level (blue dotted line). From this level, a continued upward movement is possible to the upper fractal at 1.2828 (daily candle from 28/12/2023).
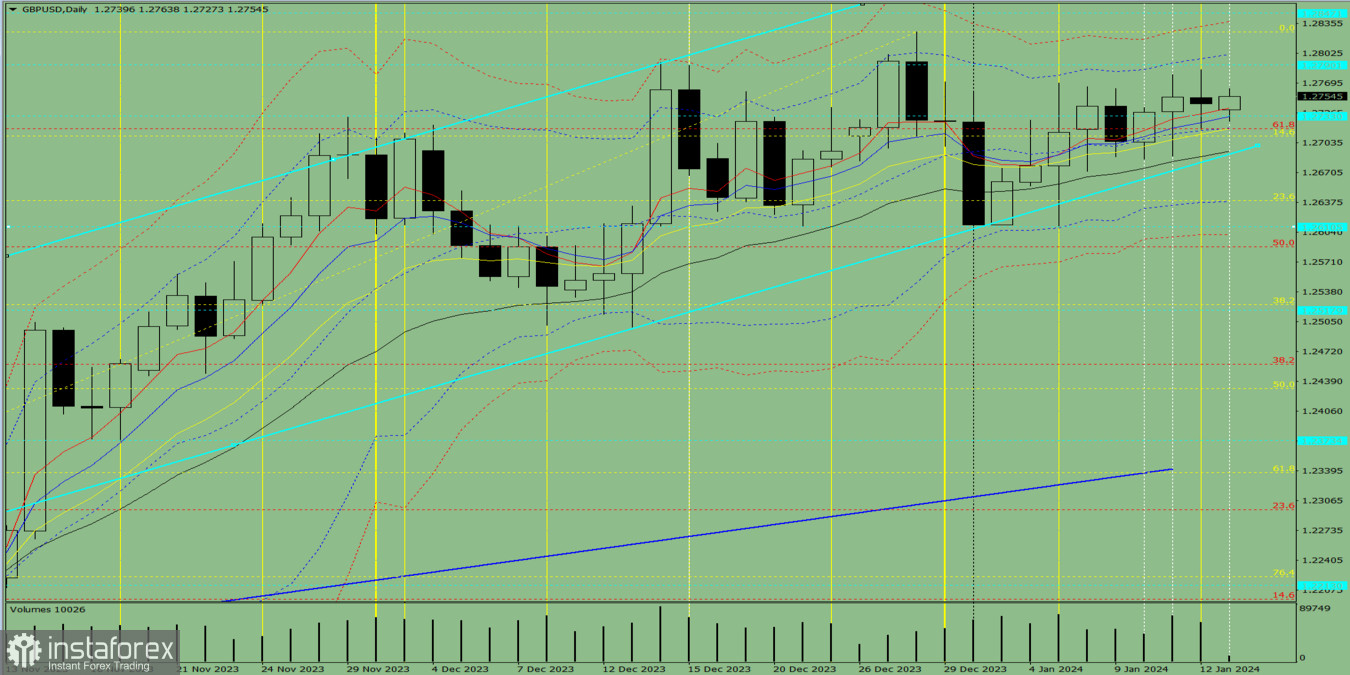
Fig. 1 (daily chart).
Comprehensive analysis:
General conclusion: Today, the price may move upward from the level of 1.2747 (closing of Friday's daily candlestick) to 1.2790, the historical resistance level (blue dotted line). From this level, a continued upward movement is possible to the upper fractal at 1.2828 (daily candle from 28/12/2023).
Alternatively, the price may move upward from level of 1.2747 (closing of Friday's daily candlestick) to 1.2790, the historical resistance level (blue dotted line). Then, the price may decline with the target at 1.2733, the historical support level (blue dotted line).
*Phân tích thị trường được đăng tải ở đây có nghĩa là để gia tăng nhận thức của bạn, nhưng không đưa ra các chỉ dẫn để thực hiện một giao dịch.
InstaSpot analytical reviews will make you fully aware of market trends! Being an InstaSpot client, you are provided with a large number of free services for efficient trading.


