


Kumpulan kami mempunyai lebih daripada 7,000,000 pedagang!
Setiap hari kami bekerjasama untuk meningkatkan perdagangan. Kami mendapat keputusan yang tinggi dan bergerak ke hadapan.
Pengiktirafan oleh berjuta-juta pedagang di seluruh dunia adalah penghargaan terbaik untuk kerja kami! Anda membuat pilihan anda dan kami akan melakukan segalanya yang diperlukan untuk memenuhi jangkaan anda!
Kami adalah kumpulan yang terbaik bersama!
InstaSpot. Berbangga bekerja untuk anda!


Pelakon, juara kejohanan UFC 6 dan seorang wira sebenar!
Lelaki yang membuat dirinya sendiri. Lelaki yang mengikut cara kami.
Rahsia di sebalik kejayaan Taktarov adalah pergerakan berterusan ke arah matlamat.
Dedahkan semua segi bakat anda!
Cari, cuba, gagal - tetapi tidak pernah berhenti!
InstaSpot. Kisah kejayaan anda bermula di sini!

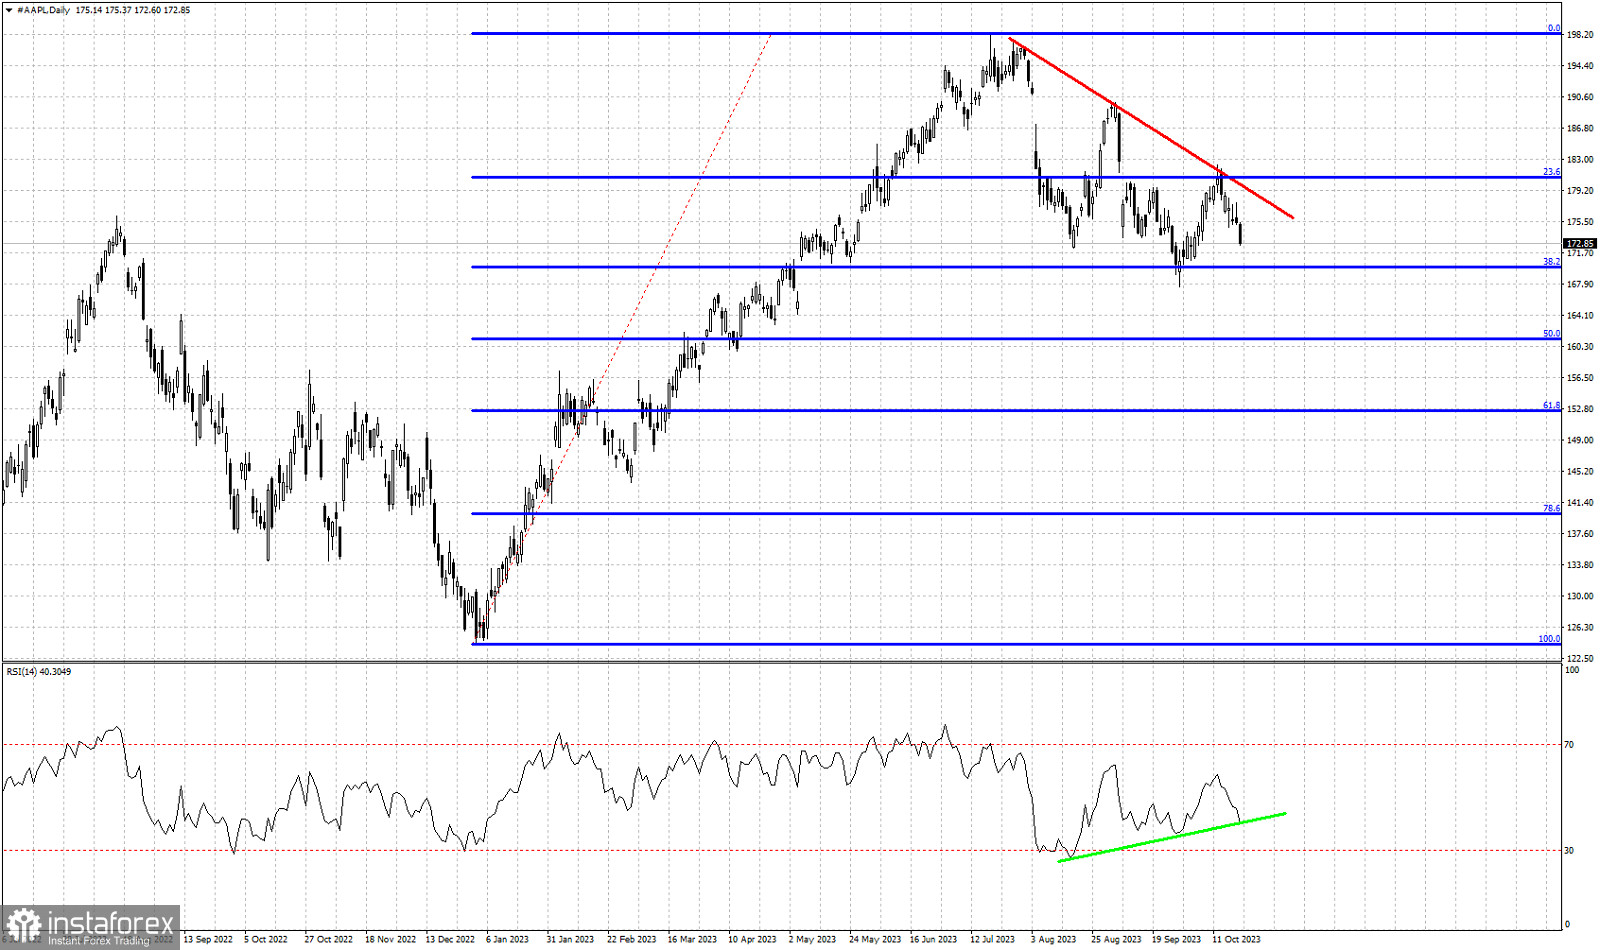
Red lines- bearish trend line
Blue lines- Fibonacci retracement levels
green line- RSI support trend line
AAPL stock price closed at its weekly low this past week. Price got rejected at the red resistance trend line at $182 resistance area and is now moving lower as expected by our previous analysis. Thus far price has formed two lower highs and two lower lows. Will we see a third lower low? Support is found at $170 where we see the 38% Fibonacci retracement where price bounced off last time. The RSI is challenging its own support trend line at recent close of $172.85. If selling pressures continue next week, we should expect $170 to be tested and maybe see new lower lows towards the 50% Fibonacci retracement at $161.30. Bears remain in control of the trend. So far we have no indication of a major low or trend reversal.
* Analisis pasaran yang disiarkan di sini adalah bertujuan untuk meningkatkan kesedaran anda, tetapi tidak untuk memberi arahan untuk membuat perdagangan.
Kajian analisis InstaSpot akan membuat anda mengetahui sepenuhnya aliran pasaran! Sebagai pelanggan InstaSpot, anda disediakan sejumlah besar perkhidmatan percuma untuk dagangan yang cekap.


