


La leggenda nel team InstaSpot!!
Legenda! Pensi che sia troppo patetico? Ma come dobbiamo chiamare un uomo, che è diventato il primo dell'Asia a vincere il campionato mondiale di scacchi a 18 anni e che è diventato il primo Gran Maestro indiano a 19? Fu l'inizio di un duro cammino verso il titolo di campione del mondo, l'uomo che divenne per sempre una parte della storia di scacchi. Un'altra leggenda nel team InstaSpot!


Il Borussia è una delle squadre di calcio più titolate in Germania, che ha ripetutamente dimostrato ai tifosi che lo spirito di competizione e leadership porta al successo. Fai trading nello stesso modo in cui lo fanno i professionisti dello sport - fiduciosamente e attivamente. Segui il Borussia FC e sii avanti con InstaSpot!

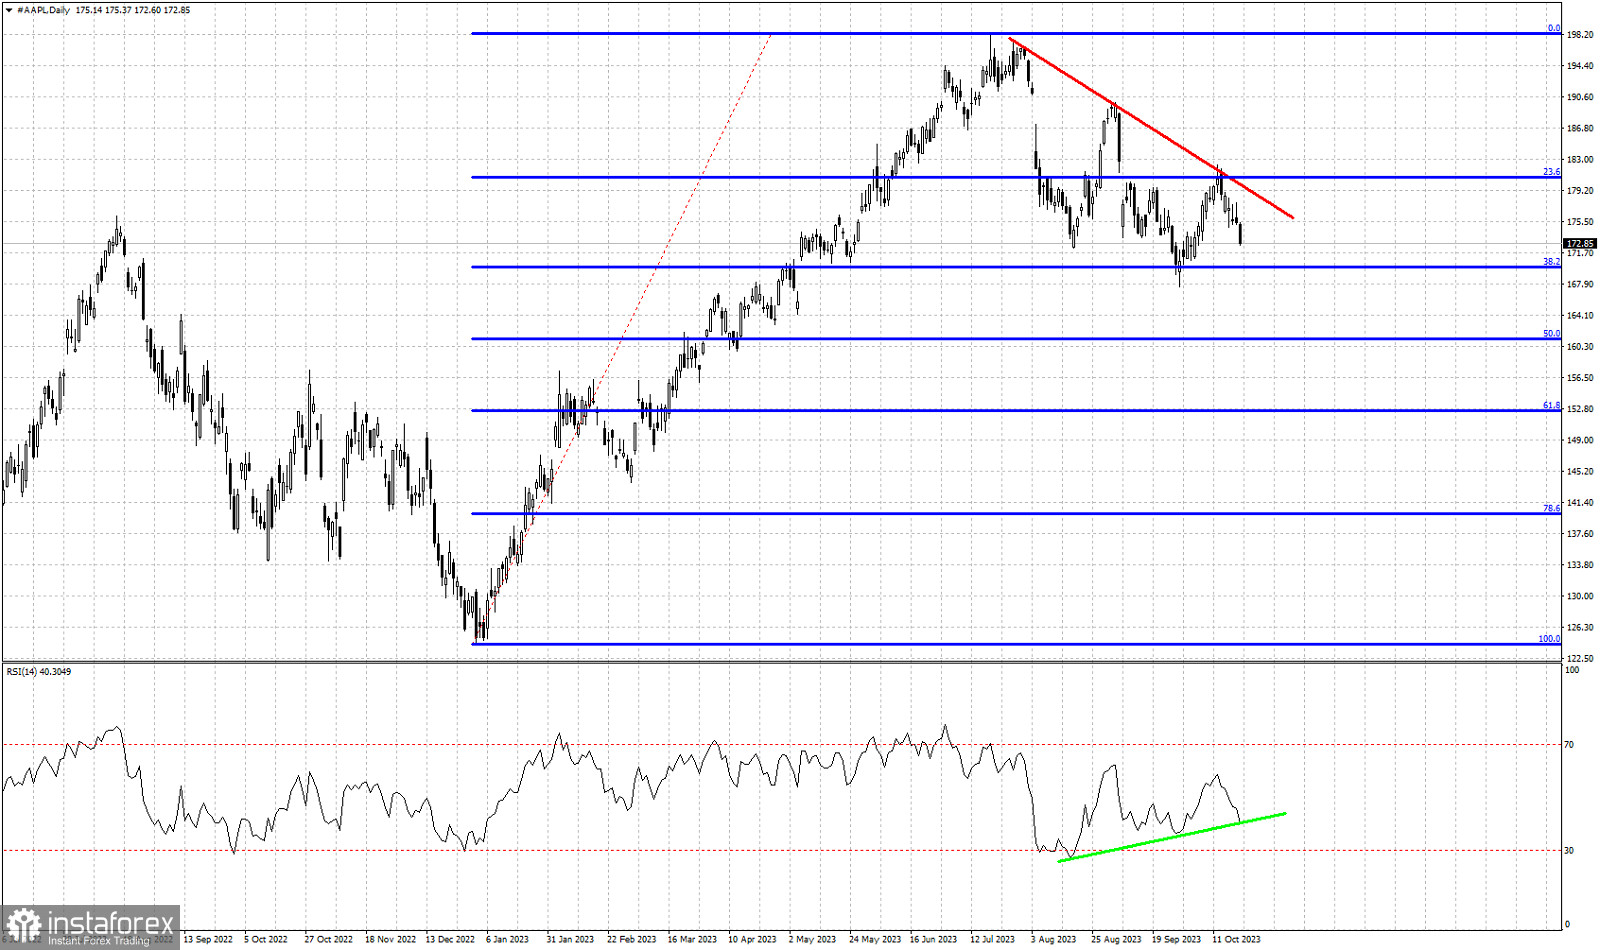
Red lines- bearish trend line
Blue lines- Fibonacci retracement levels
green line- RSI support trend line
AAPL stock price closed at its weekly low this past week. Price got rejected at the red resistance trend line at $182 resistance area and is now moving lower as expected by our previous analysis. Thus far price has formed two lower highs and two lower lows. Will we see a third lower low? Support is found at $170 where we see the 38% Fibonacci retracement where price bounced off last time. The RSI is challenging its own support trend line at recent close of $172.85. If selling pressures continue next week, we should expect $170 to be tested and maybe see new lower lows towards the 50% Fibonacci retracement at $161.30. Bears remain in control of the trend. So far we have no indication of a major low or trend reversal.
*La presente analisi del mercato ha un carattere esclusivamente informativo e non rappresenta una guida per l`effettuazione di una transazione.
Le recensioni analitiche di InstaSpot ti renderanno pienamente consapevole delle tendenze del mercato! Essendo un cliente InstaSpot, ti viene fornito un gran numero di servizi gratuiti per il trading efficiente.


