


Nossa equipe tem mais de 7,000,000 traders!
Todos os dias, trabalhamos juntos para melhorar a negociação. Obtivemos resultados elevados e avançamos.
O reconhecimento de milhões de traders em todo o mundo é a melhor apreciação do nosso trabalho! Você nos escolheu e faremos tudo o que for necessário para atender às suas expectativas!
Nós somos uma ótima equipe juntos!
InstaSpot. Orgulho de trabalhar para você!


Ator, hexacampeão do UFC e um verdadeiro herói!
Um homem de sucesso. Um homem que mostra o nosso caminho.
O segredo por trás do sucesso de Taktarov é um movimento constante em direção ao objetivo.
Revele todos os lados do seu talento!
Descubra, tente, falhe, mas nunca pare!
I InstaSpot. Sua história de sucesso começa aqui!
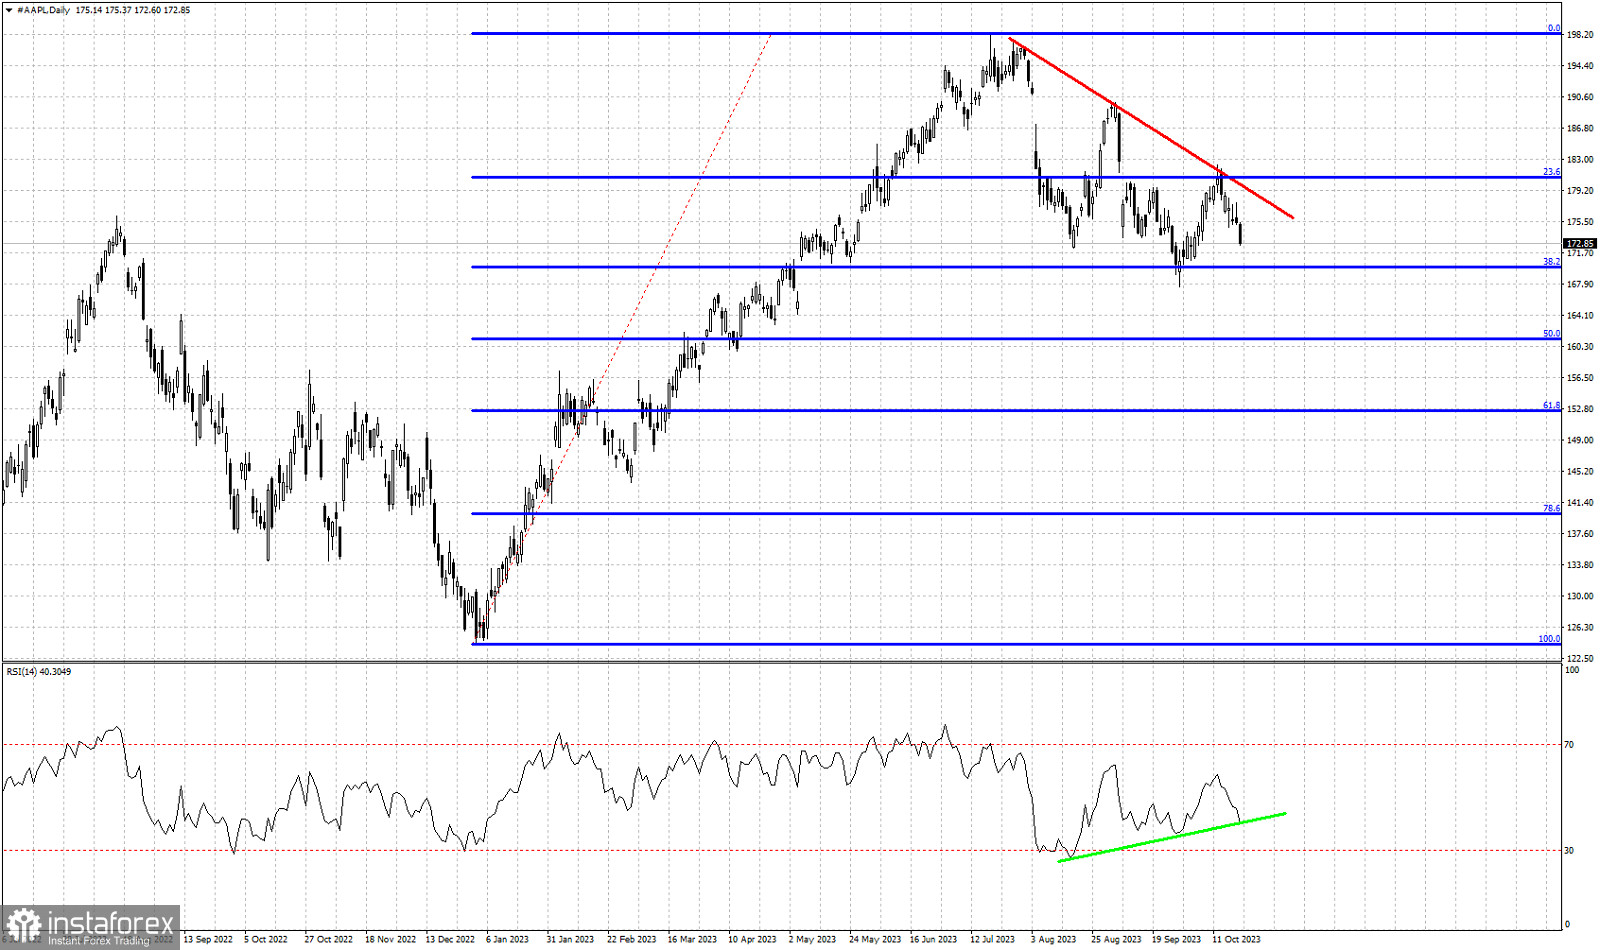
Red lines- bearish trend line
Blue lines- Fibonacci retracement levels
green line- RSI support trend line
AAPL stock price closed at its weekly low this past week. Price got rejected at the red resistance trend line at $182 resistance area and is now moving lower as expected by our previous analysis. Thus far price has formed two lower highs and two lower lows. Will we see a third lower low? Support is found at $170 where we see the 38% Fibonacci retracement where price bounced off last time. The RSI is challenging its own support trend line at recent close of $172.85. If selling pressures continue next week, we should expect $170 to be tested and maybe see new lower lows towards the 50% Fibonacci retracement at $161.30. Bears remain in control of the trend. So far we have no indication of a major low or trend reversal.
*A análise de mercado aqui postada destina-se a aumentar o seu conhecimento, mas não dar instruções para fazer uma negociação.
InstaSpot analytical reviews will make you fully aware of market trends! Being an InstaSpot client, you are provided with a large number of free services for efficient trading.


