


Kumpulan kami mempunyai lebih daripada 7,000,000 pedagang!
Setiap hari kami bekerjasama untuk meningkatkan perdagangan. Kami mendapat keputusan yang tinggi dan bergerak ke hadapan.
Pengiktirafan oleh berjuta-juta pedagang di seluruh dunia adalah penghargaan terbaik untuk kerja kami! Anda membuat pilihan anda dan kami akan melakukan segalanya yang diperlukan untuk memenuhi jangkaan anda!
Kami adalah kumpulan yang terbaik bersama!
InstaSpot. Berbangga bekerja untuk anda!


Pelakon, juara kejohanan UFC 6 dan seorang wira sebenar!
Lelaki yang membuat dirinya sendiri. Lelaki yang mengikut cara kami.
Rahsia di sebalik kejayaan Taktarov adalah pergerakan berterusan ke arah matlamat.
Dedahkan semua segi bakat anda!
Cari, cuba, gagal - tetapi tidak pernah berhenti!
InstaSpot. Kisah kejayaan anda bermula di sini!

Industrial production growth in the United States accelerated to 5.33% from 3.9%, beating market expectations of 3.4%. In light of the strong results, the pound sterling and the euro showed a modest rise in value, while demand for the greenback increased among traders.
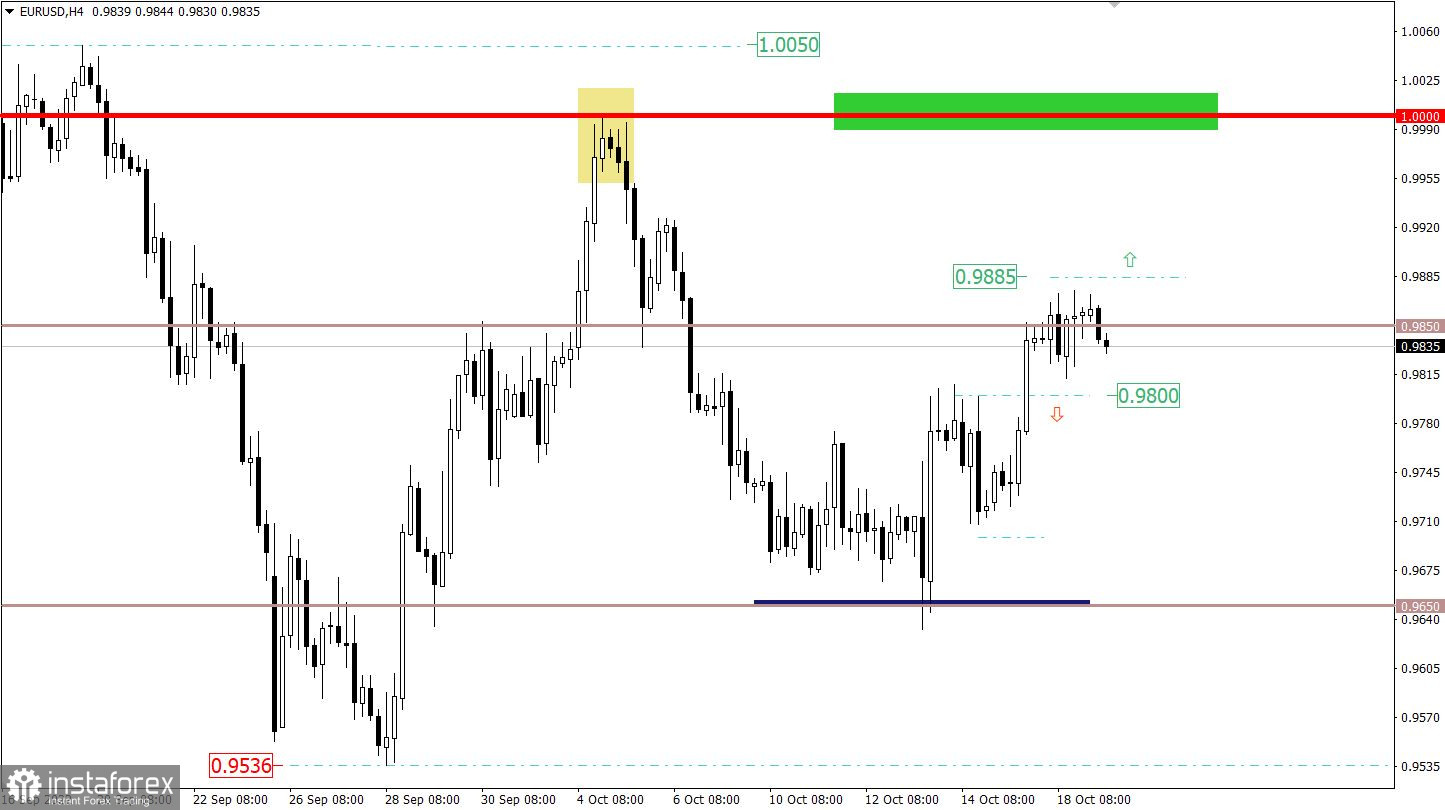
The number of long positions on EUR/USD decreased within the key level of 0.9850. Consequently, a slowdown in the uptrend led to a standstill/pullback.
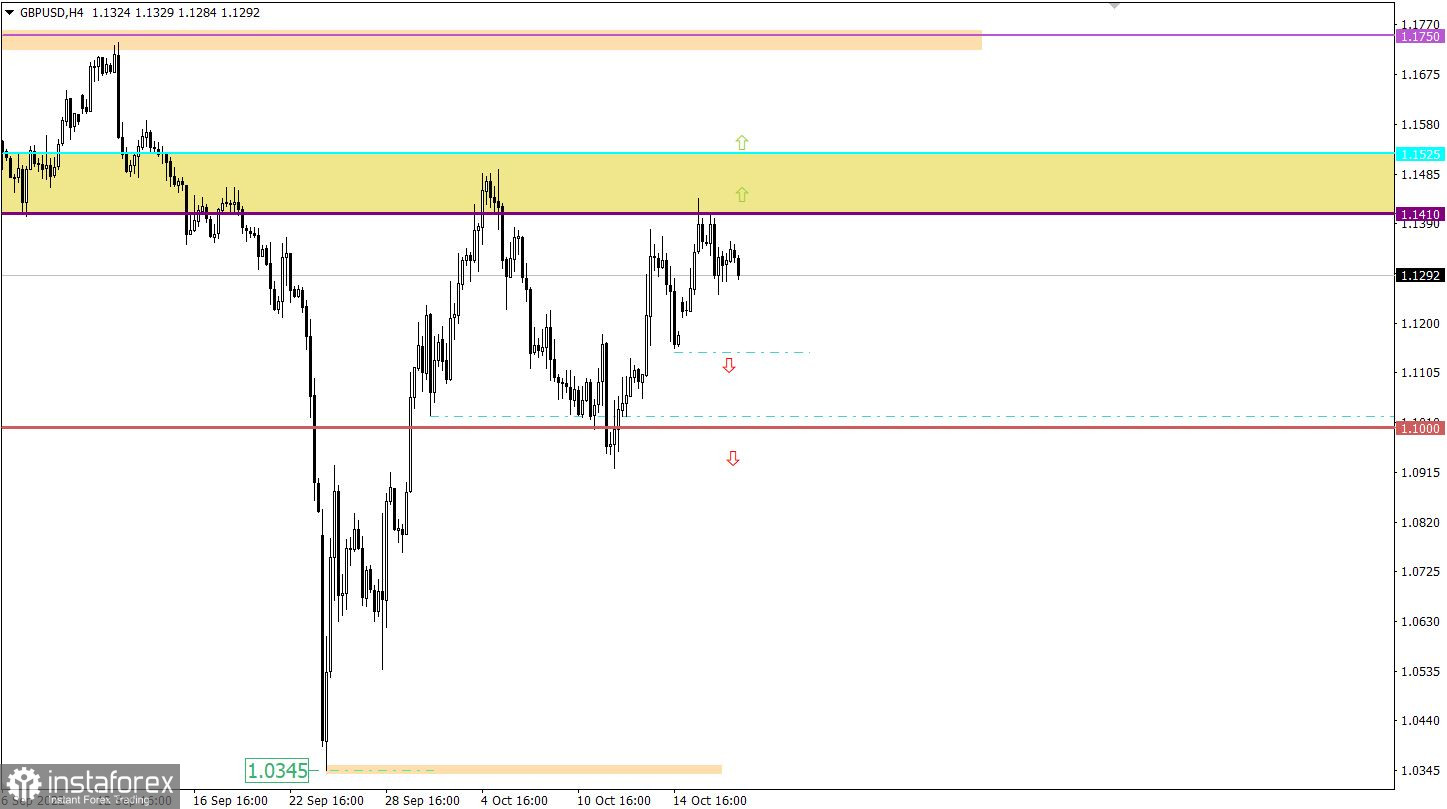
During the course of the recent uptrend, GBP/USD approached 1.1410/1.1525 resistance. The price reached the barrier thrice. As a result, the trend slowed and a pullback occurred.
Today, the United Kingdom saw the release of its inflation data during the European session. Consumer prices in the country rose to 10.1%.
In light of an increase in inflation, the Bank of England is likely to remain hawkish.
A similar report is due today in the eurozone. Should the final results not come in line with the preliminary estimates, this would trigger market jitters. In fact, the market is ready for a new rise in the reading as it has already priced in the flash data.
Under current circumstances, it would be wiser to focus on the limits of the sideways channel, seen at 0.9810 and 0.9875. This range is passing exactly along the key level of 0.9850, which could indicate the accumulation process.
Consider buying the instrument after consolidation above 0.9885.
Short poisons could be opened after the price settles below 0.9800.
A candlestick chart shows white and black bars with lines at the top and bottom. When analyzed in detail, each candlestick is different depending on a time frame: the opening and closing price as well as the maximum and minimum price.
Horizontal levels are levels of support and resistance that help traders determine when a trend is likely to change.
Circles and rectangles are highlighted examples where past reversals occurred. Such highlighting indicates horizontal lines that may exert some pressure on quotes in the future.
Up/down arrows show possible future price movements.
* Analisis pasaran yang disiarkan di sini adalah bertujuan untuk meningkatkan kesedaran anda, tetapi tidak untuk memberi arahan untuk membuat perdagangan.
Kajian analisis InstaSpot akan membuat anda mengetahui sepenuhnya aliran pasaran! Sebagai pelanggan InstaSpot, anda disediakan sejumlah besar perkhidmatan percuma untuk dagangan yang cekap.


