


The legend in the InstaSpot team!
Legend! You think that's bombastic rhetoric? But how should we call a man, who became the first Asian to win the junior world chess championship at 18 and who became the first Indian Grandmaster at 19? That was the start of a hard path to the World Champion title for Viswanathan Anand, the man who became a part of history of chess forever. Now one more legend in the InstaSpot team!


Borussia is one of the most titled football clubs in Germany, which has repeatedly proved to fans: the spirit of competition and leadership will certainly lead to success. Trade in the same way that sports professionals play the game: confidently and actively. Keep a "pass" from Borussia FC and be in the lead with InstaSpot!
Industrial production growth in the United States accelerated to 5.33% from 3.9%, beating market expectations of 3.4%. In light of the strong results, the pound sterling and the euro showed a modest rise in value, while demand for the greenback increased among traders.
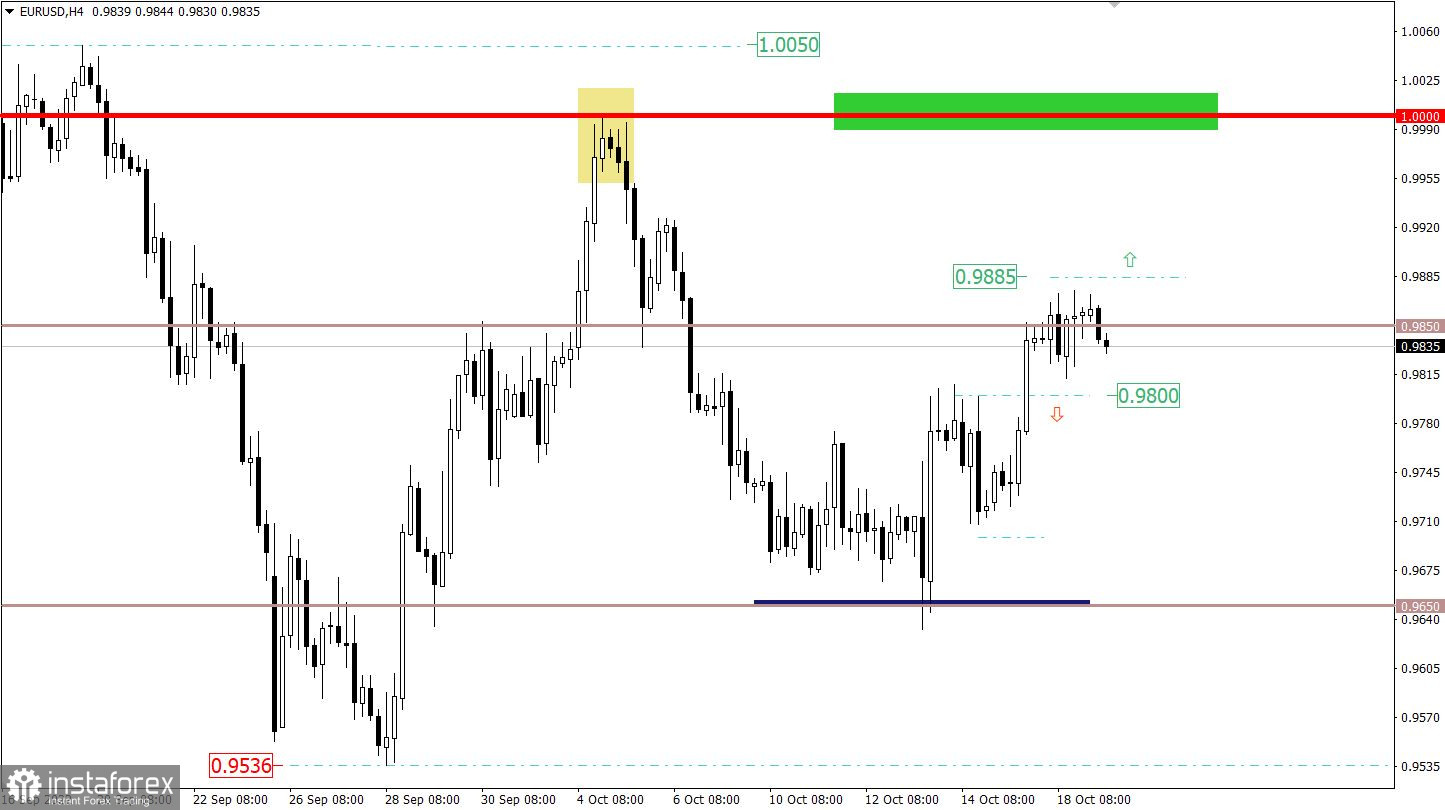
The number of long positions on EUR/USD decreased within the key level of 0.9850. Consequently, a slowdown in the uptrend led to a standstill/pullback.
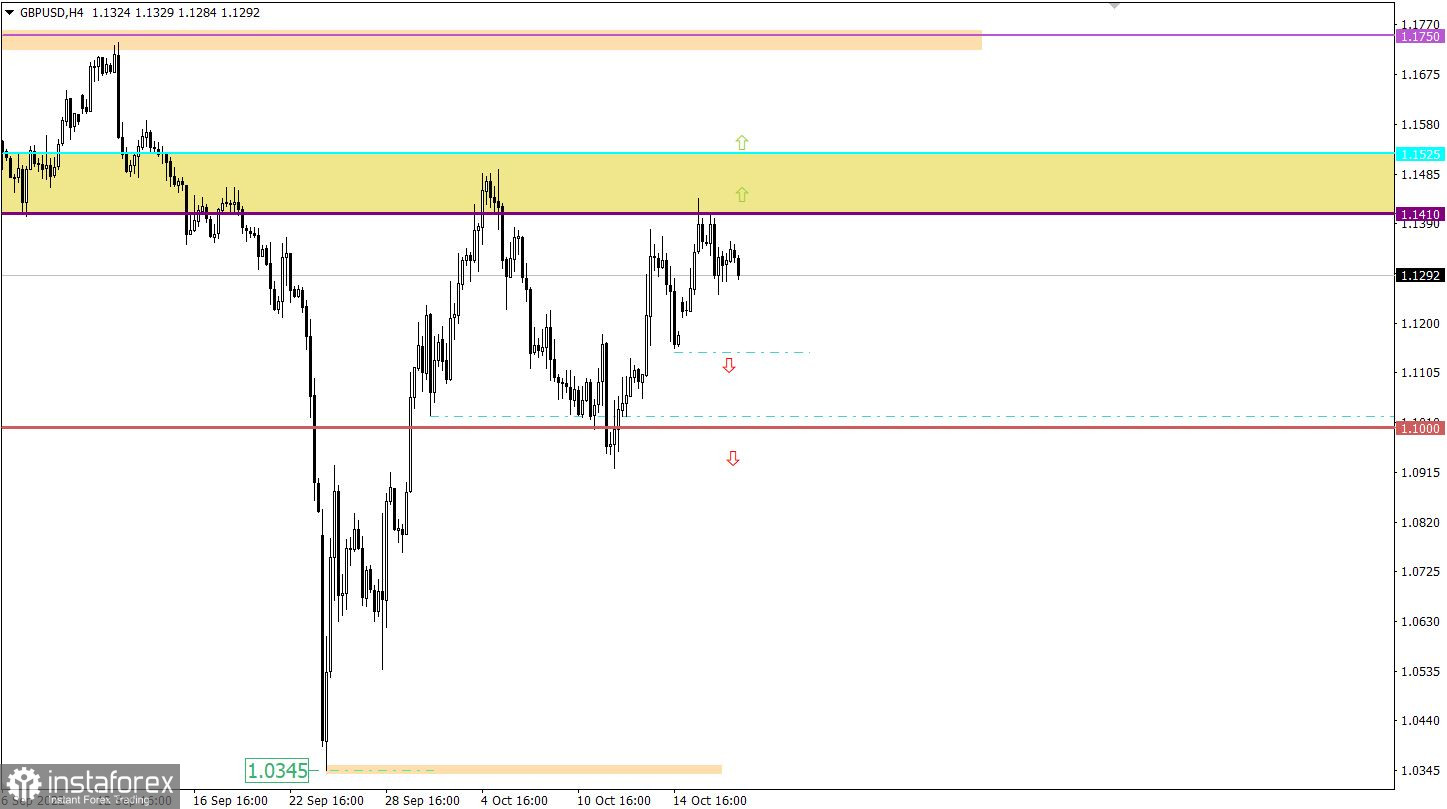
During the course of the recent uptrend, GBP/USD approached 1.1410/1.1525 resistance. The price reached the barrier thrice. As a result, the trend slowed and a pullback occurred.
Today, the United Kingdom saw the release of its inflation data during the European session. Consumer prices in the country rose to 10.1%.
In light of an increase in inflation, the Bank of England is likely to remain hawkish.
A similar report is due today in the eurozone. Should the final results not come in line with the preliminary estimates, this would trigger market jitters. In fact, the market is ready for a new rise in the reading as it has already priced in the flash data.
Under current circumstances, it would be wiser to focus on the limits of the sideways channel, seen at 0.9810 and 0.9875. This range is passing exactly along the key level of 0.9850, which could indicate the accumulation process.
Consider buying the instrument after consolidation above 0.9885.
Short poisons could be opened after the price settles below 0.9800.
A candlestick chart shows white and black bars with lines at the top and bottom. When analyzed in detail, each candlestick is different depending on a time frame: the opening and closing price as well as the maximum and minimum price.
Horizontal levels are levels of support and resistance that help traders determine when a trend is likely to change.
Circles and rectangles are highlighted examples where past reversals occurred. Such highlighting indicates horizontal lines that may exert some pressure on quotes in the future.
Up/down arrows show possible future price movements.
*这里的市场分析是为了增加您对市场的了解,而不是给出交易的指示。
InstaSpot分析评论将让您充分了解市场趋势! 作为InstaSpot的客户,您将获得大量的免费服务以实现有效的交易。


