


Huyền thoại trong nhóm InstaSpot!
Huyền thoại! Bạn nghĩ rằng đó là lời nói khoa trương? Nhưng chúng ta nên gọi một người đàn ông như thế nào, người đã trở thành người châu Á đầu tiên giành chức vô địch cờ vua thế giới lứa tuổi thiếu niên năm 18 tuổi và người trở thành Đại kiện tướng Ấn Độ đầu tiên năm 19 tuổi? Đó là khởi đầu cho con đường khó khăn đến danh hiệu Vô địch Thế giới của Viswanathan Anand, người đàn ông đã trở thành một phần của lịch sử cờ vua mãi mãi. Giờ đây, một huyền thoại nữa trong nhóm InstaSpot!


Borussia là một trong những câu lạc bộ bóng đá danh giá nhất nước Đức, đã nhiều lần chứng minh cho người hâm mộ thấy: tinh thần thi đấu và sự lãnh đạo chắc chắn sẽ dẫn đến thành công. Giao dịch theo cách mà các chuyên gia thể thao chơi trò chơi: tự tin và chủ động. Giữ một "đường chuyền" từ Borussia FC và dẫn đầu với InstaSpot!
Industrial production growth in the United States accelerated to 5.33% from 3.9%, beating market expectations of 3.4%. In light of the strong results, the pound sterling and the euro showed a modest rise in value, while demand for the greenback increased among traders.
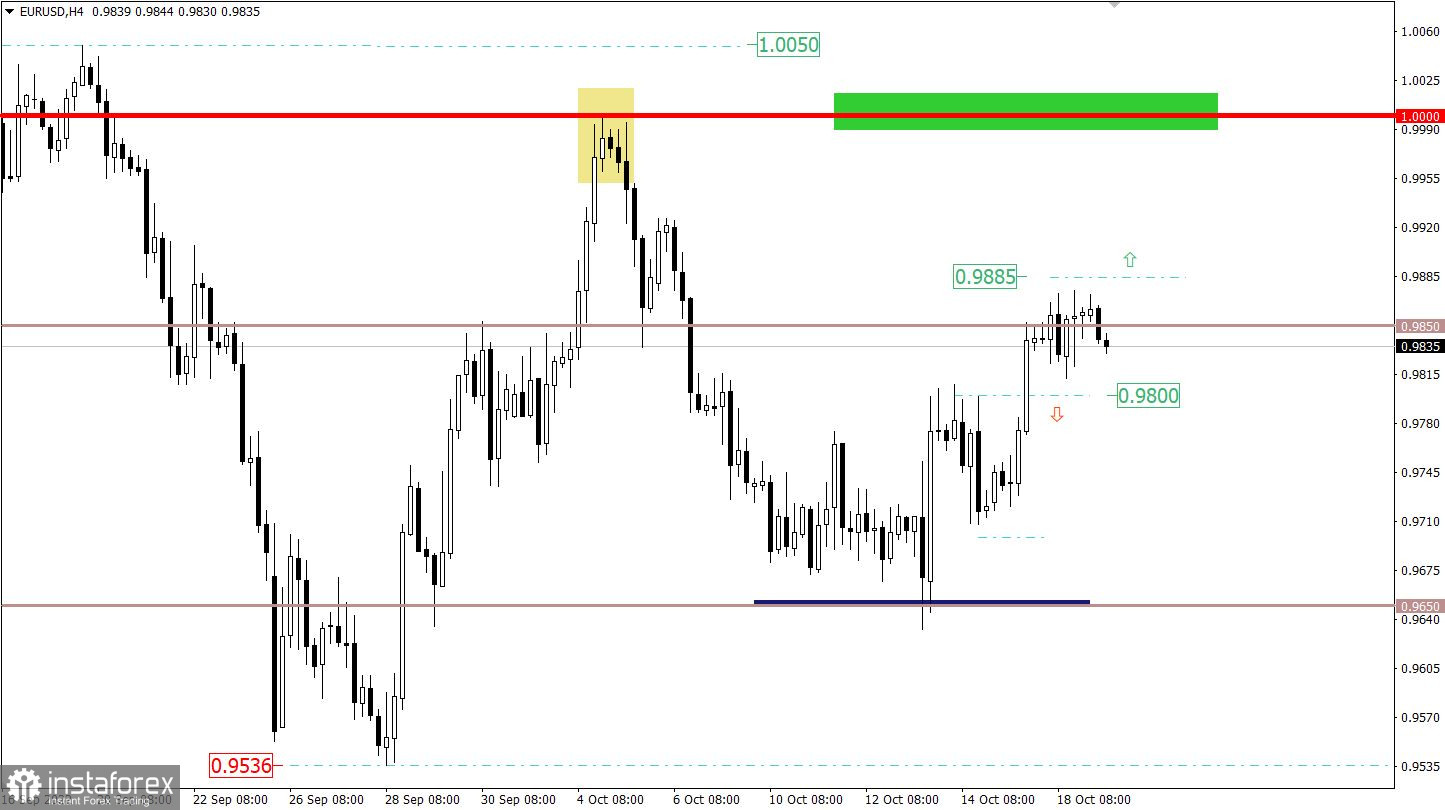
The number of long positions on EUR/USD decreased within the key level of 0.9850. Consequently, a slowdown in the uptrend led to a standstill/pullback.
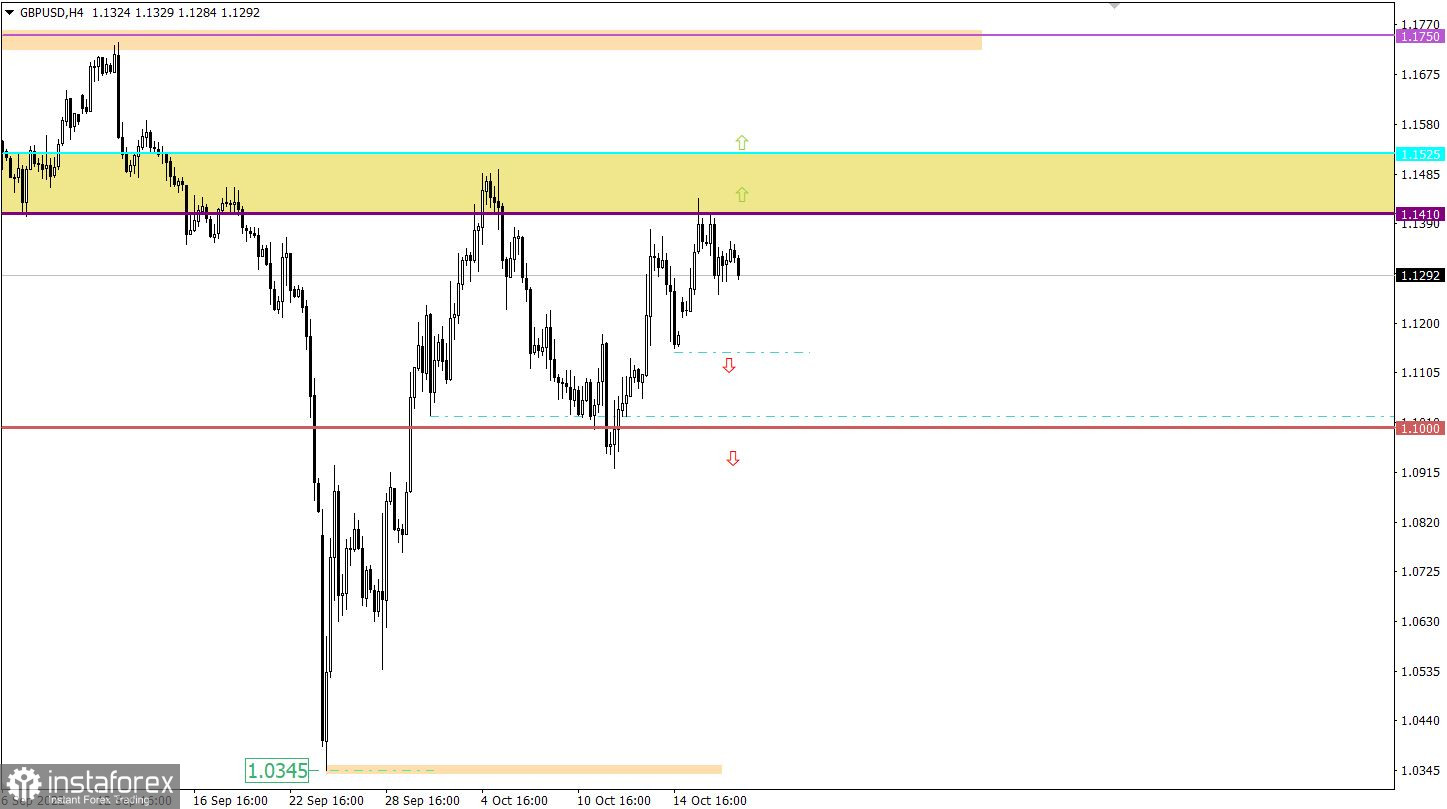
During the course of the recent uptrend, GBP/USD approached 1.1410/1.1525 resistance. The price reached the barrier thrice. As a result, the trend slowed and a pullback occurred.
Today, the United Kingdom saw the release of its inflation data during the European session. Consumer prices in the country rose to 10.1%.
In light of an increase in inflation, the Bank of England is likely to remain hawkish.
A similar report is due today in the eurozone. Should the final results not come in line with the preliminary estimates, this would trigger market jitters. In fact, the market is ready for a new rise in the reading as it has already priced in the flash data.
Under current circumstances, it would be wiser to focus on the limits of the sideways channel, seen at 0.9810 and 0.9875. This range is passing exactly along the key level of 0.9850, which could indicate the accumulation process.
Consider buying the instrument after consolidation above 0.9885.
Short poisons could be opened after the price settles below 0.9800.
A candlestick chart shows white and black bars with lines at the top and bottom. When analyzed in detail, each candlestick is different depending on a time frame: the opening and closing price as well as the maximum and minimum price.
Horizontal levels are levels of support and resistance that help traders determine when a trend is likely to change.
Circles and rectangles are highlighted examples where past reversals occurred. Such highlighting indicates horizontal lines that may exert some pressure on quotes in the future.
Up/down arrows show possible future price movements.
*Phân tích thị trường được đăng tải ở đây có nghĩa là để gia tăng nhận thức của bạn, nhưng không đưa ra các chỉ dẫn để thực hiện một giao dịch.
InstaSpot analytical reviews will make you fully aware of market trends! Being an InstaSpot client, you are provided with a large number of free services for efficient trading.


