


Kumpulan kami mempunyai lebih daripada 7,000,000 pedagang!
Setiap hari kami bekerjasama untuk meningkatkan perdagangan. Kami mendapat keputusan yang tinggi dan bergerak ke hadapan.
Pengiktirafan oleh berjuta-juta pedagang di seluruh dunia adalah penghargaan terbaik untuk kerja kami! Anda membuat pilihan anda dan kami akan melakukan segalanya yang diperlukan untuk memenuhi jangkaan anda!
Kami adalah kumpulan yang terbaik bersama!
InstaSpot. Berbangga bekerja untuk anda!


Pelakon, juara kejohanan UFC 6 dan seorang wira sebenar!
Lelaki yang membuat dirinya sendiri. Lelaki yang mengikut cara kami.
Rahsia di sebalik kejayaan Taktarov adalah pergerakan berterusan ke arah matlamat.
Dedahkan semua segi bakat anda!
Cari, cuba, gagal - tetapi tidak pernah berhenti!
InstaSpot. Kisah kejayaan anda bermula di sini!

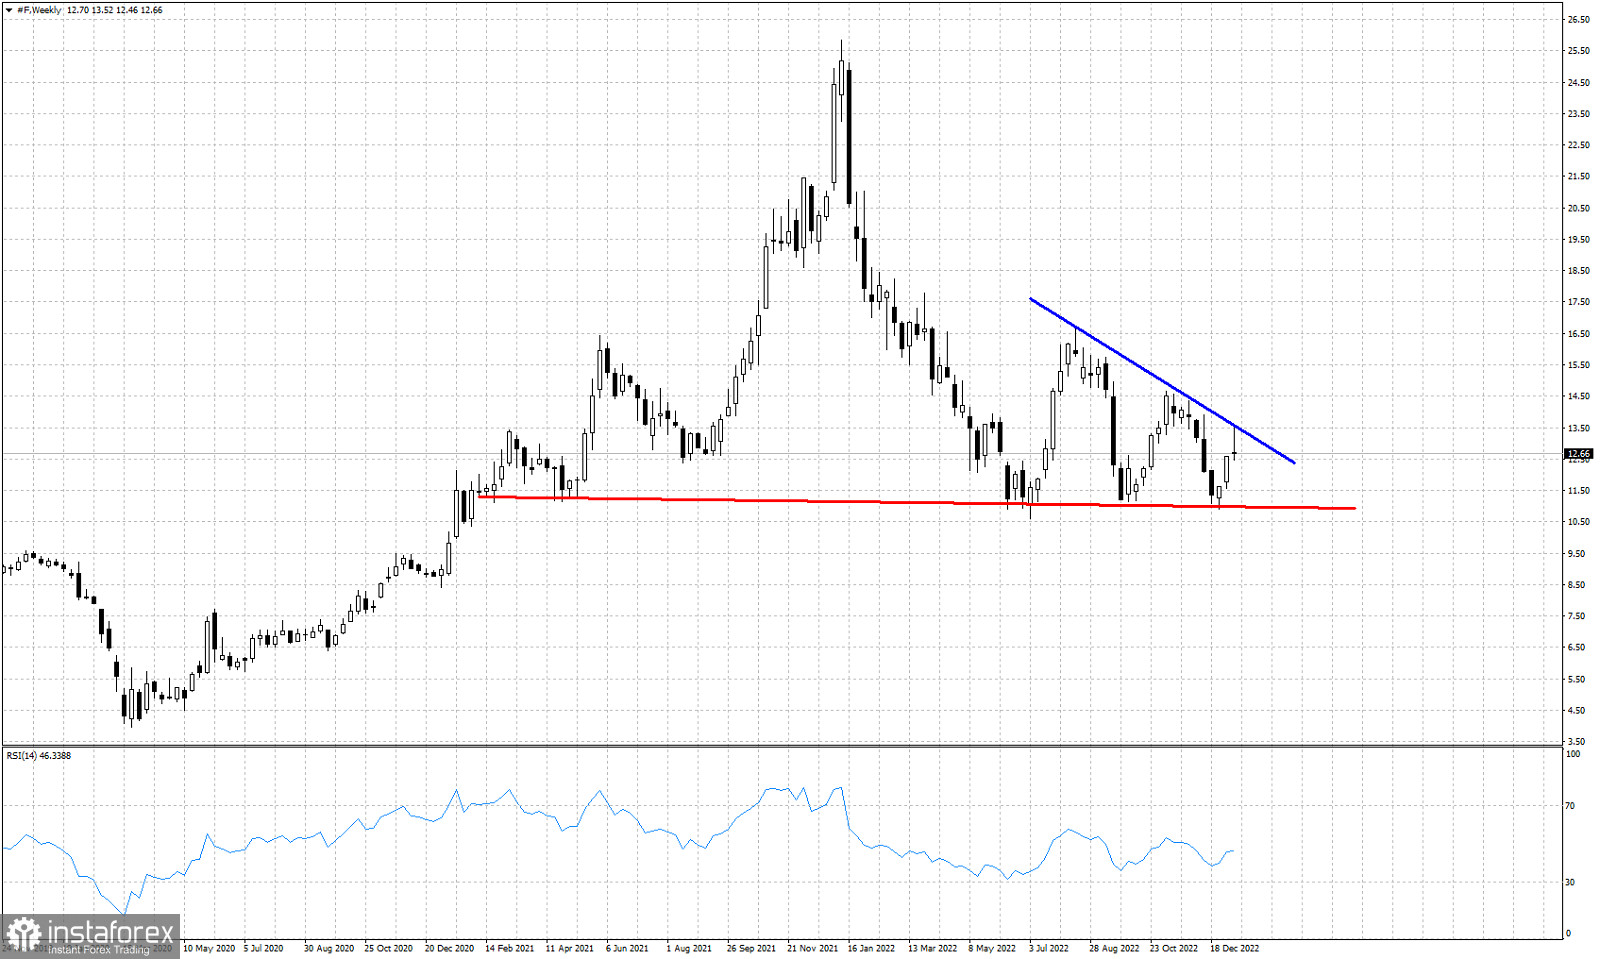
Red line- support
Blue line- resistance
Ford stock price is trading around $12.61. In our previous analysis when price was bouncing off the key horizontal support of $11 we mentioned that we should expect the bounce to at least reach the resistance of $13.70. Price this week made a high very close to the resistance trend line at $13.50 and got rejected. Price remains below the key resistance trend line that has already provided two major pull backs towards $11. A break above the blue trend line would be a bullish signal for Ford stock. This week's candle with the long upper tail is not good for bulls. If next week price remains under pressure, we should not be surprised to see it reach $11 again.
* Analisis pasaran yang disiarkan di sini adalah bertujuan untuk meningkatkan kesedaran anda, tetapi tidak untuk memberi arahan untuk membuat perdagangan.
Kajian analisis InstaSpot akan membuat anda mengetahui sepenuhnya aliran pasaran! Sebagai pelanggan InstaSpot, anda disediakan sejumlah besar perkhidmatan percuma untuk dagangan yang cekap.


