


The legend in the InstaSpot team!
Legend! You think that's bombastic rhetoric? But how should we call a man, who became the first Asian to win the junior world chess championship at 18 and who became the first Indian Grandmaster at 19? That was the start of a hard path to the World Champion title for Viswanathan Anand, the man who became a part of history of chess forever. Now one more legend in the InstaSpot team!


Borussia is one of the most titled football clubs in Germany, which has repeatedly proved to fans: the spirit of competition and leadership will certainly lead to success. Trade in the same way that sports professionals play the game: confidently and actively. Keep a "pass" from Borussia FC and be in the lead with InstaSpot!
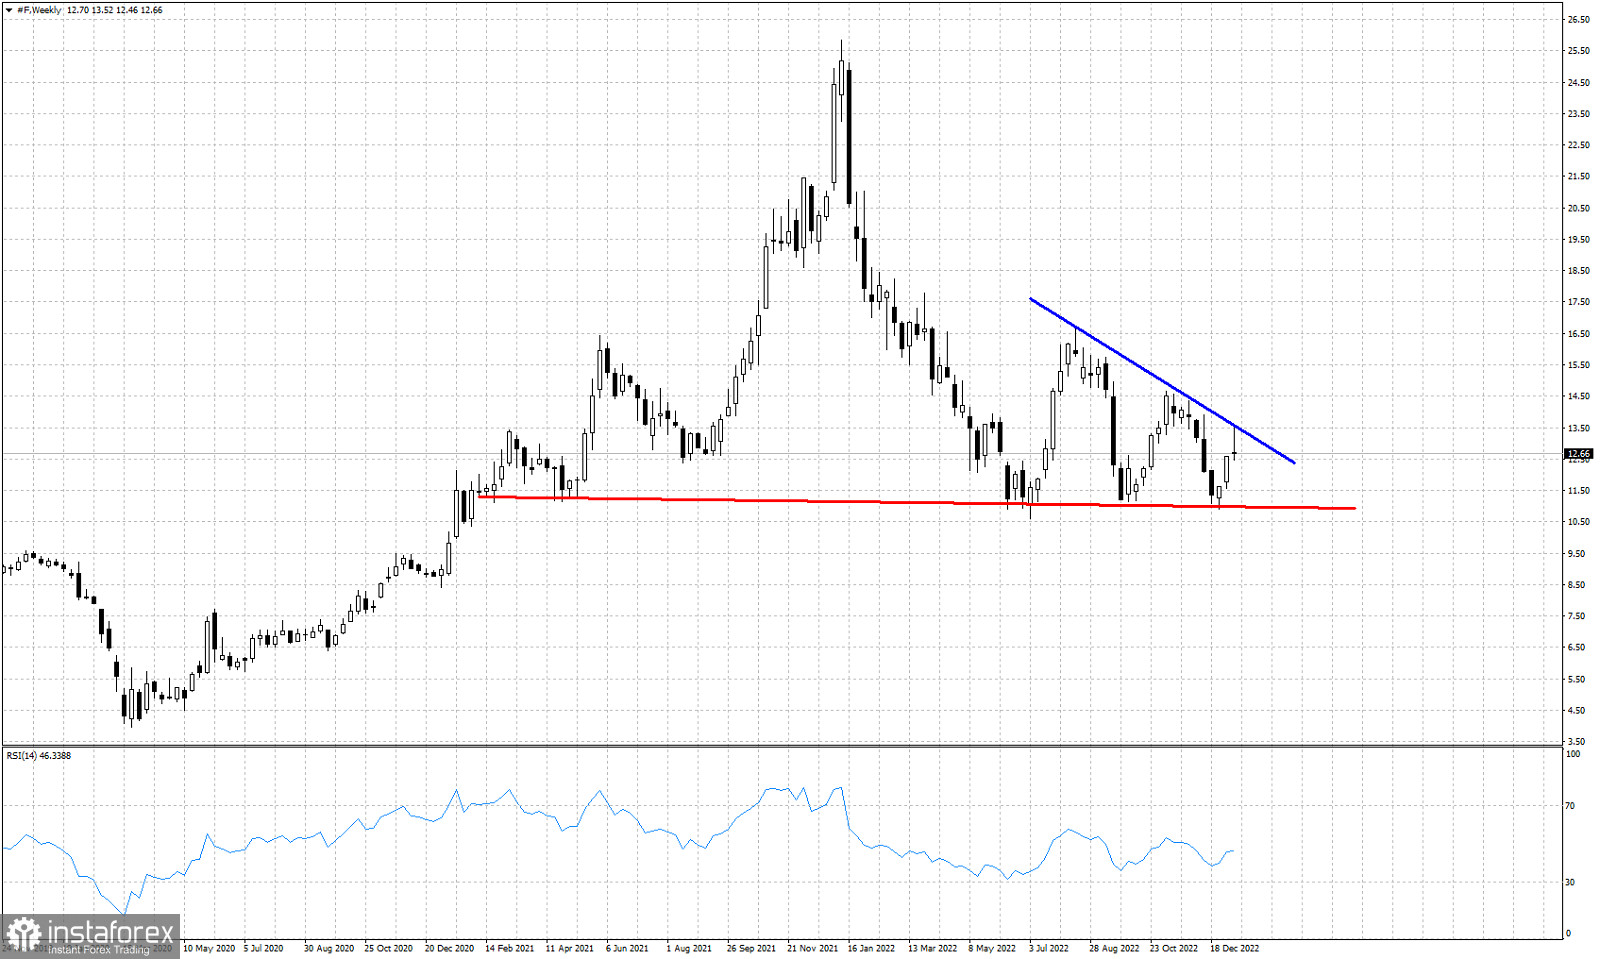
Red line- support
Blue line- resistance
Ford stock price is trading around $12.61. In our previous analysis when price was bouncing off the key horizontal support of $11 we mentioned that we should expect the bounce to at least reach the resistance of $13.70. Price this week made a high very close to the resistance trend line at $13.50 and got rejected. Price remains below the key resistance trend line that has already provided two major pull backs towards $11. A break above the blue trend line would be a bullish signal for Ford stock. This week's candle with the long upper tail is not good for bulls. If next week price remains under pressure, we should not be surprised to see it reach $11 again.
*这里的市场分析是为了增加您对市场的了解,而不是给出交易的指示。
InstaSpot分析评论将让您充分了解市场趋势! 作为InstaSpot的客户,您将获得大量的免费服务以实现有效的交易。


