


فريقنا لديه أكثر من 7,000,000 من التجار!
كل يوم نعمل معا لتحسين التداول. نحصل على نتائج عالية ونمضي قدما.
الاعتراف من قبل الملايين من التجار في جميع أنحاء العالم هو أفضل تقدير لعملنا! لقد قمت باختيارك وسنفعل كل ما يلزم لتلبية توقعاتك!
نحن فريق رائع معا!
إنستافوركس تعتز بالعمل بالنسبة لك!


الممثل وبطل مسابقة يو إف سي 6 وبطل حقيقي!
الرجل الذي حقق النجاح بعمله الدؤوب. الرجل الذي يذهب كما نريد.
سر نجاح تاكتاروف هو حركة مستمرة نحو الهدف.
اكشف عن جميع جوانب موهبتك!
اكتشف، وحاول، وافشل - ولكن لا تتوقف أبدا!
إنستافوركس. تبدأ قصة نجاحك من هنا!
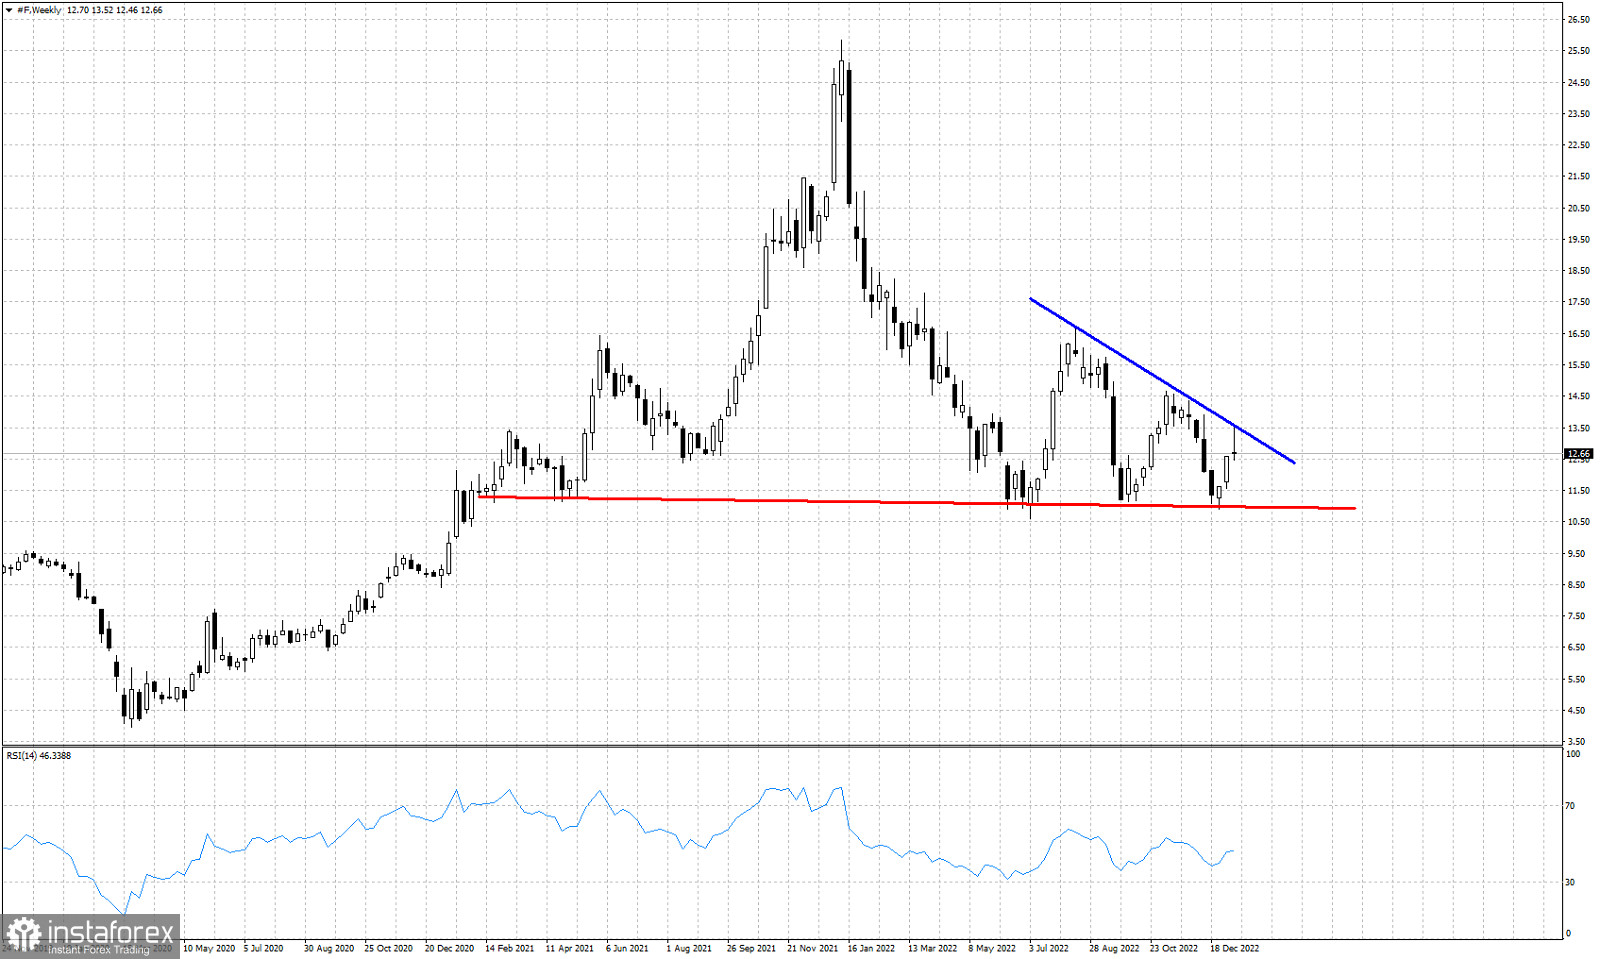
Red line- support
Blue line- resistance
Ford stock price is trading around $12.61. In our previous analysis when price was bouncing off the key horizontal support of $11 we mentioned that we should expect the bounce to at least reach the resistance of $13.70. Price this week made a high very close to the resistance trend line at $13.50 and got rejected. Price remains below the key resistance trend line that has already provided two major pull backs towards $11. A break above the blue trend line would be a bullish signal for Ford stock. This week's candle with the long upper tail is not good for bulls. If next week price remains under pressure, we should not be surprised to see it reach $11 again.
*The market analysis posted here is meant to increase your awareness, but not to give instructions to make a trade.
InstaSpot analytical reviews will make you fully aware of market trends! Being an InstaSpot client, you are provided with a large number of free services for efficient trading.


