



La leggenda nel team InstaSpot!!
Legenda! Pensi che sia troppo patetico? Ma come dobbiamo chiamare un uomo, che è diventato il primo dell'Asia a vincere il campionato mondiale di scacchi a 18 anni e che è diventato il primo Gran Maestro indiano a 19? Fu l'inizio di un duro cammino verso il titolo di campione del mondo, l'uomo che divenne per sempre una parte della storia di scacchi. Un'altra leggenda nel team InstaSpot!



Il Borussia è una delle squadre di calcio più titolate in Germania, che ha ripetutamente dimostrato ai tifosi che lo spirito di competizione e leadership porta al successo. Fai trading nello stesso modo in cui lo fanno i professionisti dello sport - fiduciosamente e attivamente. Segui il Borussia FC e sii avanti con InstaSpot!

The Bitcoin recovery remains in question, and there are signs that help explain why. The price has been stuck around $81,500 for some time, and beneath it there is none of the support that usually sustains a durable rally: spot demand has again turned negative, exchange reserves have begun to rise, and the largest holders continue to trim their balances.

According to CryptoQuant, aggregate Bitcoin reserves on all exchanges remain low at about 2,680,000 BTC. However, since the start of October, a modest increase above roughly 2,660,000 BTC has been recorded. This matters because coins on exchanges represent potential supply. The more it sits there, the easier it is for holders to sell, and a rise in reserves against a weak price is therefore a cautious signal.
Also, worth noting is the split between spot and perpetual futures demand over the past 30 days. The picture is this: spot demand recovery is stalling while futures demand is leading. In simple terms, spot means buying the actual coins, and that demand is usually steadier because buyers tend to hold long-term. Futures demand is a leveraged bet on price movement and can unwind quickly if the market moves against positions. When a rally is driven by futures rather than by real purchases, it tends to be fragile.
Compare accumulation and selling by holder cohorts over 60 days. The 100–1,000 BTC cohort continues to accumulate, but at a level below the late-September peak and with only a modest recent recovery. The 1,000–10,000 BTC cohort is reducing reserves more slowly and is approaching a neutral balance. The largest whales—balances above 10,000 BTC—continue to cut holdings, so accumulation is not broad-based. Notably, this large cohort usually sets the tone, and until it reverses, it is premature to call a sustained trend.
I believe a genuine recovery requires three signals at once: spot demand must return to positive, exchange reserves must resume declining, and whales must switch from selling to accumulation. Until that happens, I lean toward Bitcoin trading inside the recent $80,000–$85,000 corridor with a risk of another lower bound test. Additional pressure comes from continued ETF outflows, which amounted to about $229m last week. If spot and whales reverse simultaneously, a move toward the upper corridor would be quite plausible.
Technical analysis and recommendations:
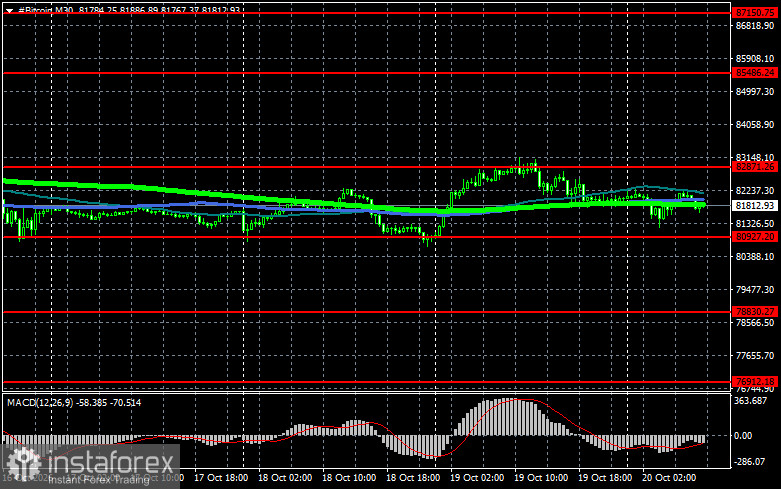
Technical picture for Bitcoin. Buyers are currently targeting a reclaim of $82,800, which would open a direct path to $85,400 and then toward $87,100; breaking $87,100 would signal attempts to restore a bull market. On the downside, buyers are expected at $80,900. A return of the trading instrument below that area could quickly push BTC toward $78,800. The most distant downside target would be around $76,900.
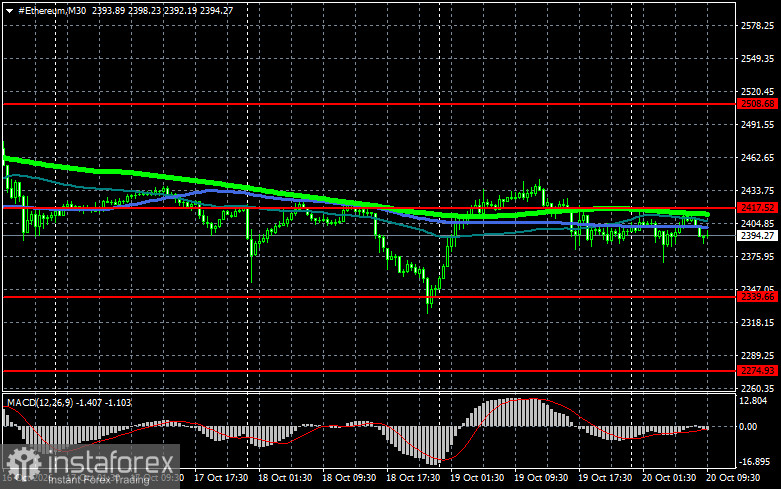
Technical picture for Ethereum. A clear hold above $2,417 would open a direct path to $2,508. The furthest upside target is the high near $2,600; breaking that level would indicate strengthening bullish sentiment and a return of buyer interest. On the downside, buyers are expected at $2,339. A return below that area could quickly push ETH toward $2,274. The most distant downside target would be around $2,231.
What we see on the chart:
- Red lines indicate support and resistance levels where either a price slowdown or active growth is expected;
- Green lines indicate the 50-day moving average;
- Blue lines indicate the 100-day moving average;
- Light green lines indicate the 200-day moving average.
A crossover, or a price test of moving averages, typically either halts the move or sparks fresh market momentum.
*La presente analisi del mercato ha un carattere esclusivamente informativo e non rappresenta una guida per l`effettuazione di una transazione.
Le recensioni analitiche di InstaSpot ti renderanno pienamente consapevole delle tendenze del mercato! Essendo un cliente InstaSpot, ti viene fornito un gran numero di servizi gratuiti per il trading efficiente.


