


Nella nostra squadra ci sono più di 7.000.000 trader! Ogni giorno ci impegniamo a far sì che il trading migliori. Conseguiamo grandi risultati e ci muoviamo in avanti.
Il riconoscimento da parte di milioni di trader in tutto il mondo rappresenta l'alta valutazione della nostra attività! Voi avete fatto la vostra scelta e noi faremo la nostra al fine di soddisfare le vostre aspettative!
Assieme siamo una grande squadra!
InstaSpot. Siamo orgogliosi di lavorare per voi!


Attore, campione del mondo di lotta libera e semplicemente un vero maciste russo! Persona venuta dal nulla. Persona che rispecchia i nostri obiettivi. Il segreto del successo di Taktarov consiste nel mirare continuamente al suo scopo.
Dischiudi anche tu tutti gli aspetti del tuo talento! Impara, prova, sbaglia, ma non fermarti!
InstaSpot - la storia delle tue vittorie inizia qui!

Blockbuster results from NVIDIA and expectations for what could be the largest IPO in history (SpaceX) allowed S&P 500 bulls to go on the offensive. That move was reinforced after the April FOMC minutes, which helped push Treasury yields and the odds of Fed tightening in 2026 lower.
S&P 500 vs Treasury yield dynamics
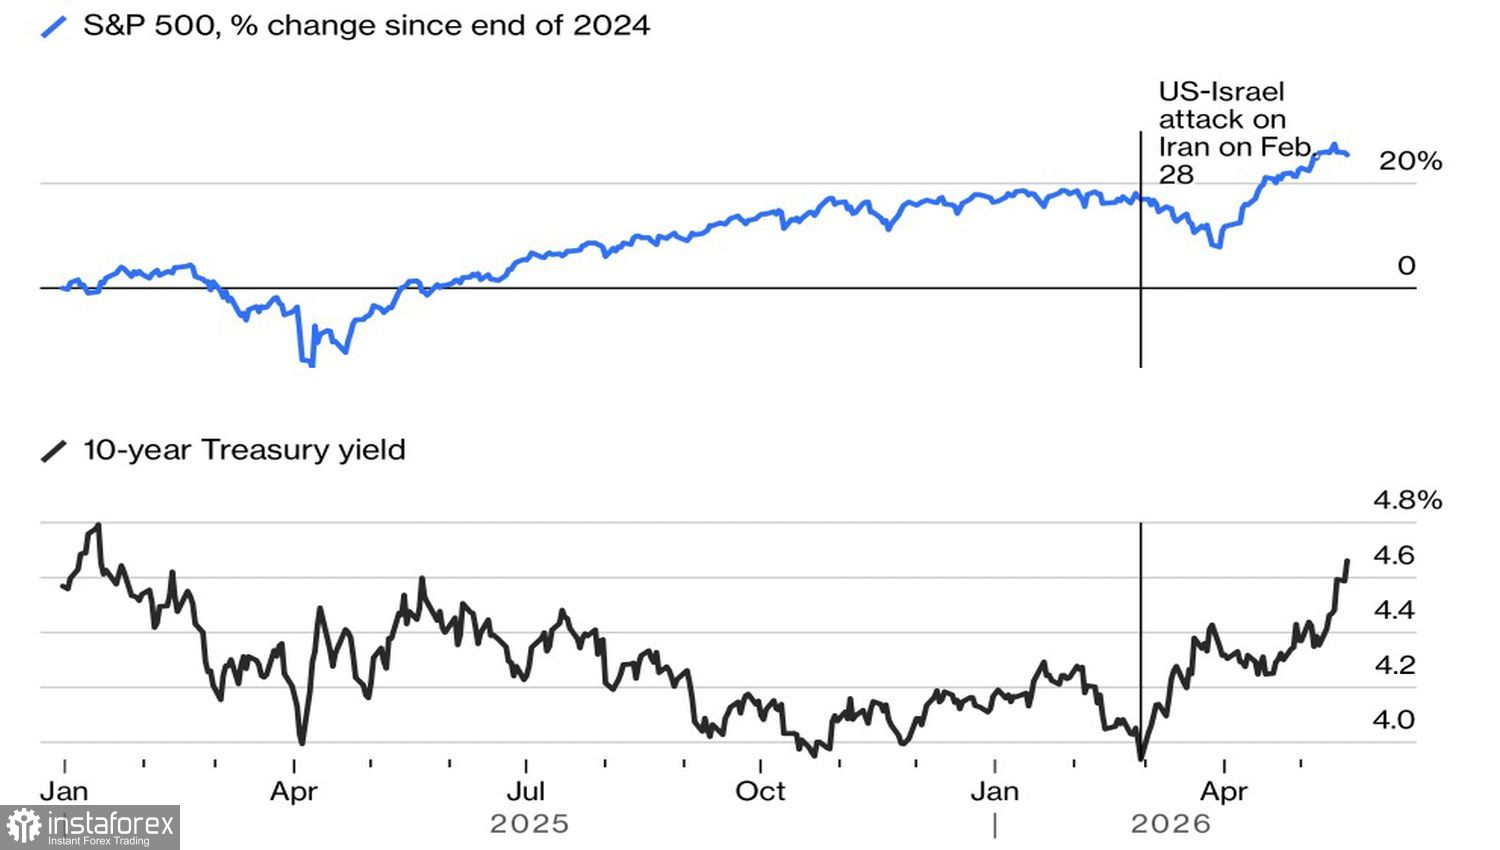
Fed officials have begun openly discussing the possibility of raising the fed funds rate. The prevailing view is that if inflation remains above the 2% target, monetary restraint will be required. The bond market greeted that debate with relief — if the Fed were not even discussing tightening, inflation might accelerate out of control. With the central bank perceived as engaged, Treasury yields retreated from recent highs and offered relief to equities.
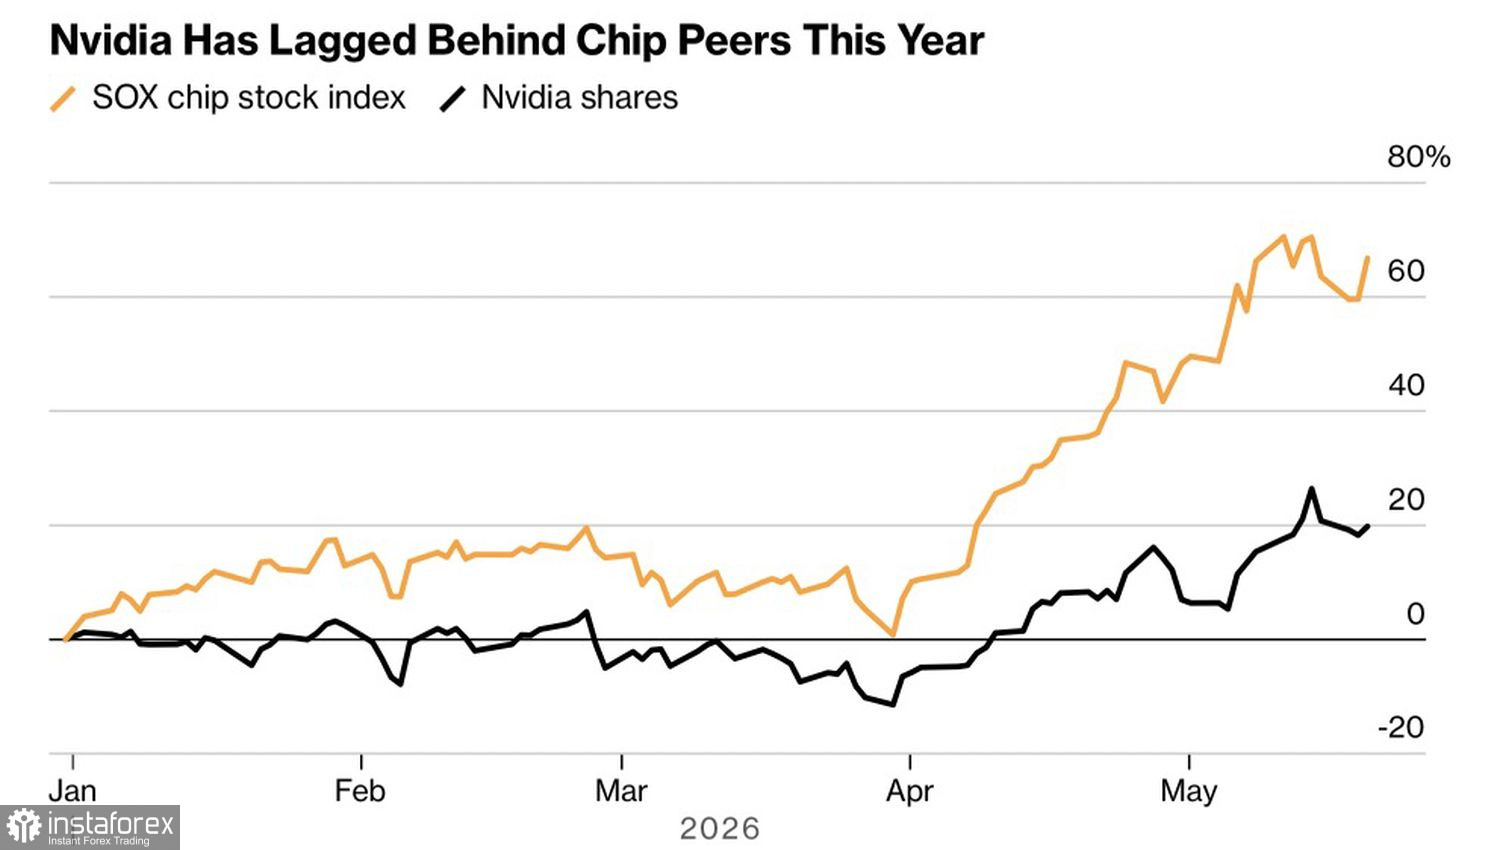
Investors had high expectations for NVIDIA's earnings, and the company did not disappoint. Q1 revenue rose by 85% to $81.6bn, and net income more than tripled to $58.3bn, beating Wall Street estimates. Still, investors recognize that the leader faces tougher conditions ahead: competition is intensifying, and chip buyers are exploring alternatives.
As a result, NVIDIA has outperformed the S&P 500 year-to-date but has lagged some other semiconductor names. Goldman Sachs reports that the semiconductor group's share of the S&P 500 market cap hit a record 19%.
S&P 500 and NVIDIA dynamics
That concentration is worrying: reliance on a handful of names can end badly — the dot-com crisis is the textbook example, when dominant sector leaders plunged by 25% within six months of their peak in 2000.
Parallels do not end there. Over the past four years, the S&P 500 has averaged annual gains of about 23%, close to the 27% seen a quarter-century ago. Forward P/E for current S&P 500 constituents stands at 20.7, above the 10-year average of 19. A similar pattern was in place prior to the dot?com collapse.
Rumors of a bubble are circulating, but a greater risk may be stagflation in the US economy, or an aggressive Fed tightening cycle to curb high prices.
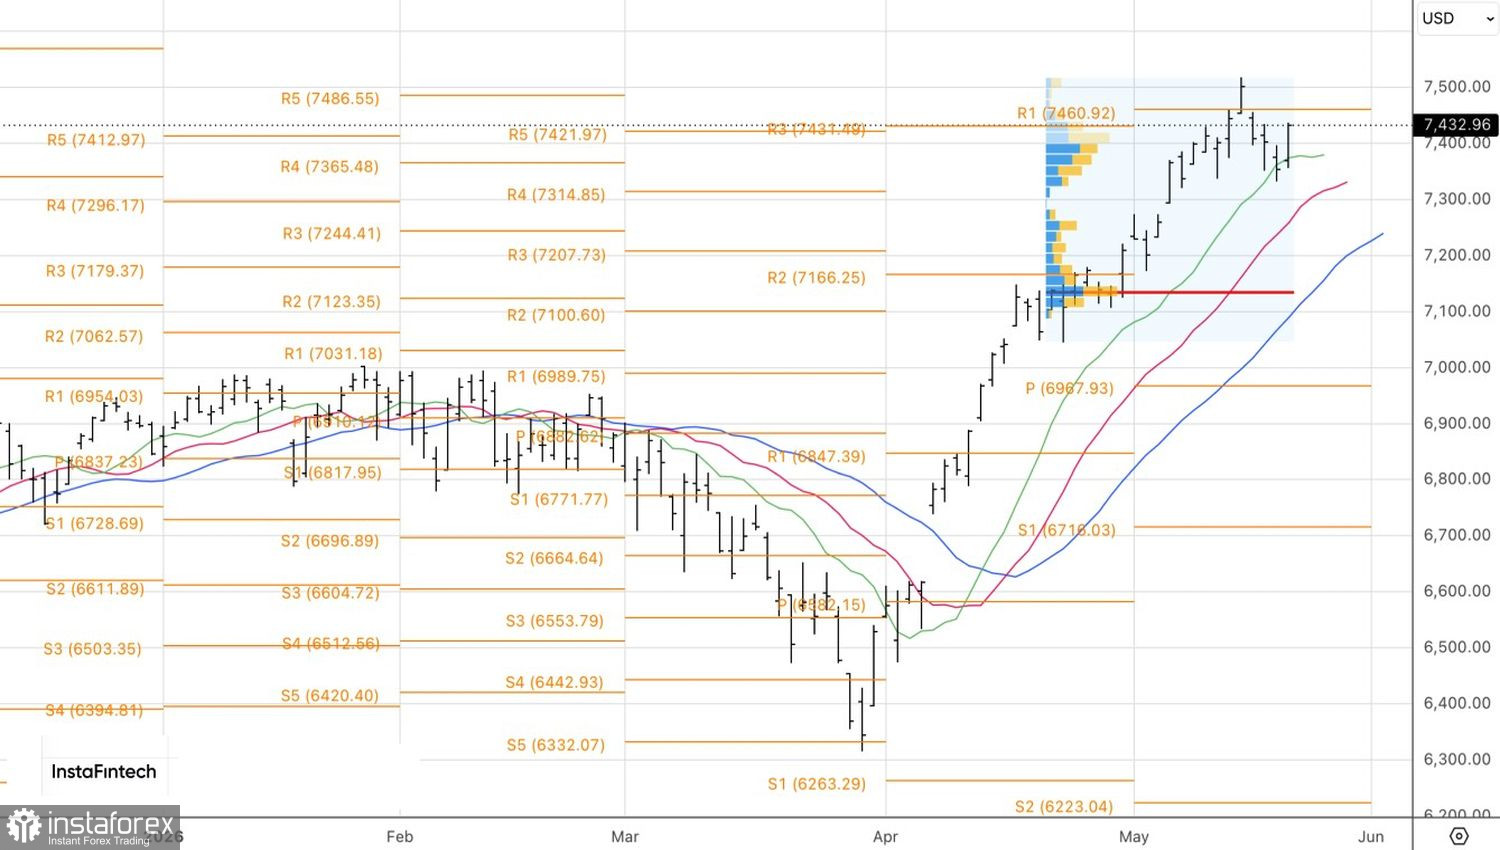
Technically, the daily chart shows that the S&P 500 bounced off a moving average and returned to the breakout-bar high. The next key test is the pivot at 7,460. Its breakout would generate a buy signal, while a retreat would favor selling.
*La presente analisi del mercato ha un carattere esclusivamente informativo e non rappresenta una guida per l`effettuazione di una transazione.
Le recensioni analitiche di InstaSpot ti renderanno pienamente consapevole delle tendenze del mercato! Essendo un cliente InstaSpot, ti viene fornito un gran numero di servizi gratuiti per il trading efficiente.


