


我们的团队有超过700万的操盘手!
我们每天都在一起努力改善交易。我们得到了很高的成绩,并继续前进。
世界各地数以百万计的操盘手的认可是我们工作的最大赞赏! 您做出了您的选择,我们将尽一切努力来满足您的期望!
我们是一个共同的伟大团队!
InstaSpot. 自豪地为您工作!


Blockbuster results from NVIDIA and expectations for what could be the largest IPO in history (SpaceX) allowed S&P 500 bulls to go on the offensive. That move was reinforced after the April FOMC minutes, which helped push Treasury yields and the odds of Fed tightening in 2026 lower.
S&P 500 vs Treasury yield dynamics
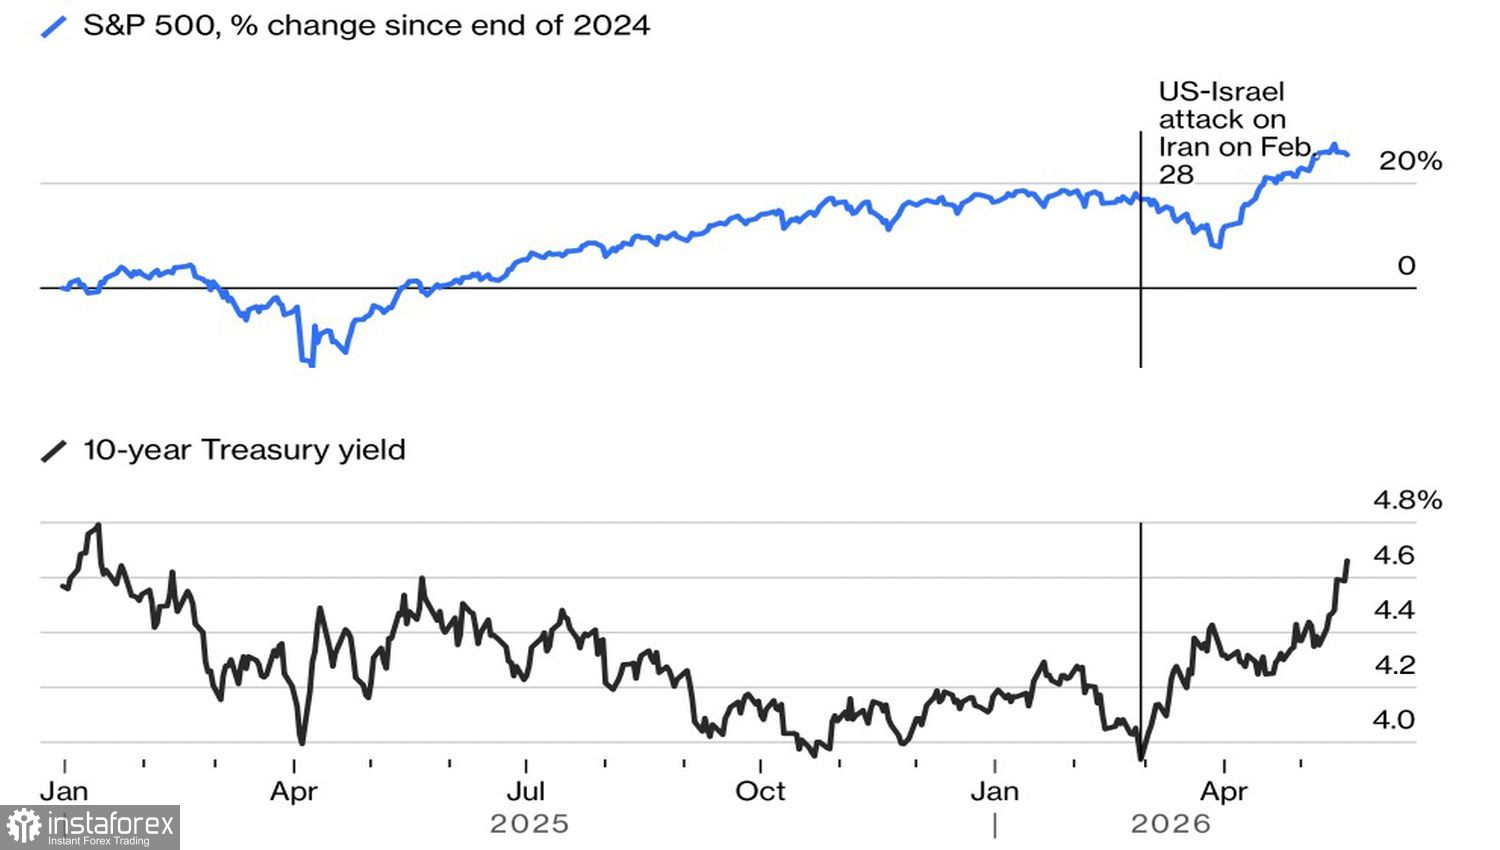
Fed officials have begun openly discussing the possibility of raising the fed funds rate. The prevailing view is that if inflation remains above the 2% target, monetary restraint will be required. The bond market greeted that debate with relief — if the Fed were not even discussing tightening, inflation might accelerate out of control. With the central bank perceived as engaged, Treasury yields retreated from recent highs and offered relief to equities.
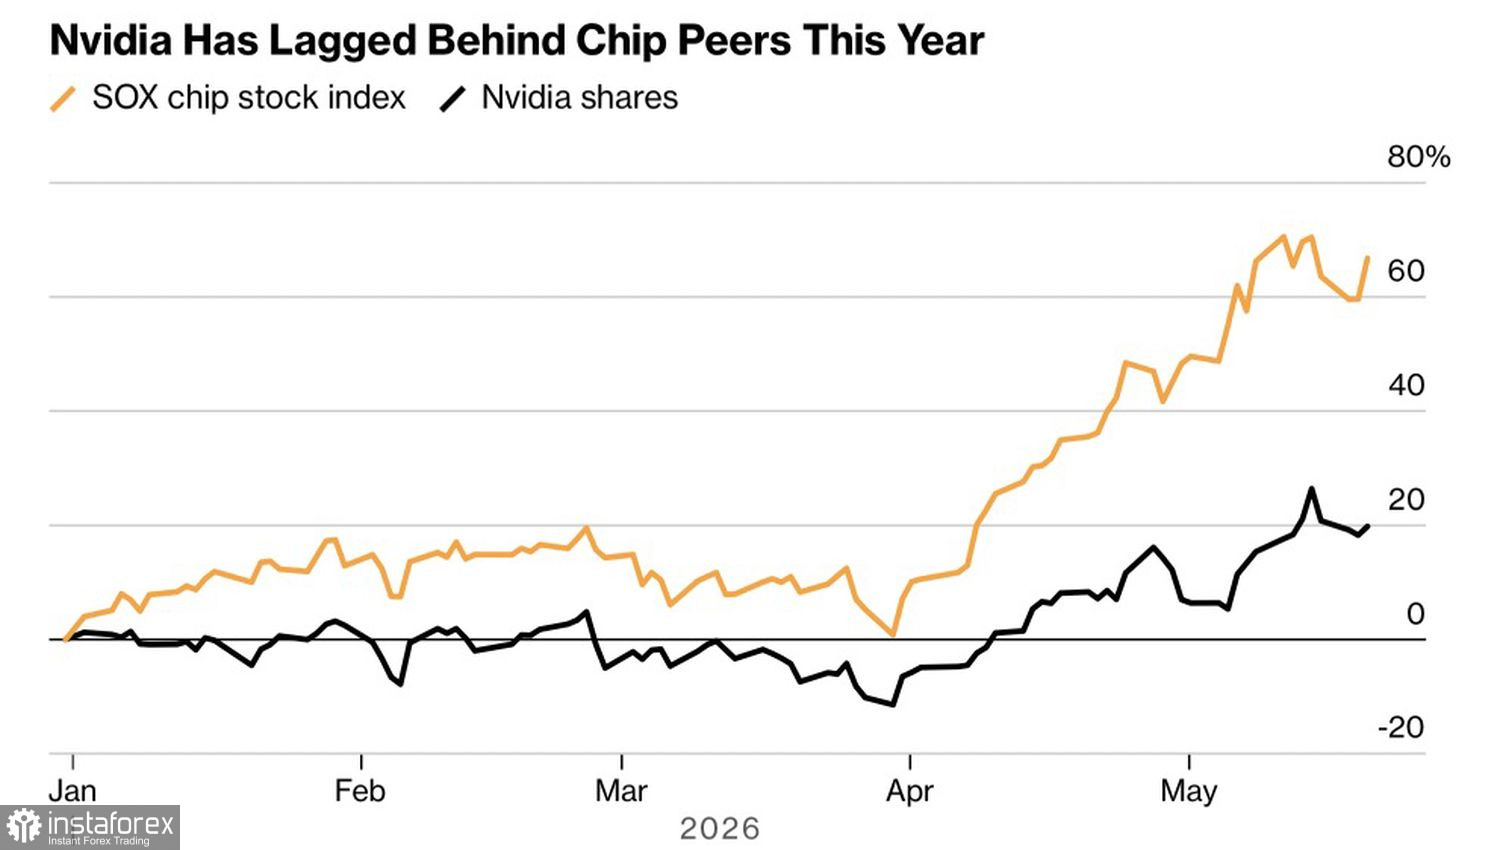
Investors had high expectations for NVIDIA's earnings, and the company did not disappoint. Q1 revenue rose by 85% to $81.6bn, and net income more than tripled to $58.3bn, beating Wall Street estimates. Still, investors recognize that the leader faces tougher conditions ahead: competition is intensifying, and chip buyers are exploring alternatives.
As a result, NVIDIA has outperformed the S&P 500 year-to-date but has lagged some other semiconductor names. Goldman Sachs reports that the semiconductor group's share of the S&P 500 market cap hit a record 19%.
S&P 500 and NVIDIA dynamics
That concentration is worrying: reliance on a handful of names can end badly — the dot-com crisis is the textbook example, when dominant sector leaders plunged by 25% within six months of their peak in 2000.
Parallels do not end there. Over the past four years, the S&P 500 has averaged annual gains of about 23%, close to the 27% seen a quarter-century ago. Forward P/E for current S&P 500 constituents stands at 20.7, above the 10-year average of 19. A similar pattern was in place prior to the dot?com collapse.
Rumors of a bubble are circulating, but a greater risk may be stagflation in the US economy, or an aggressive Fed tightening cycle to curb high prices.
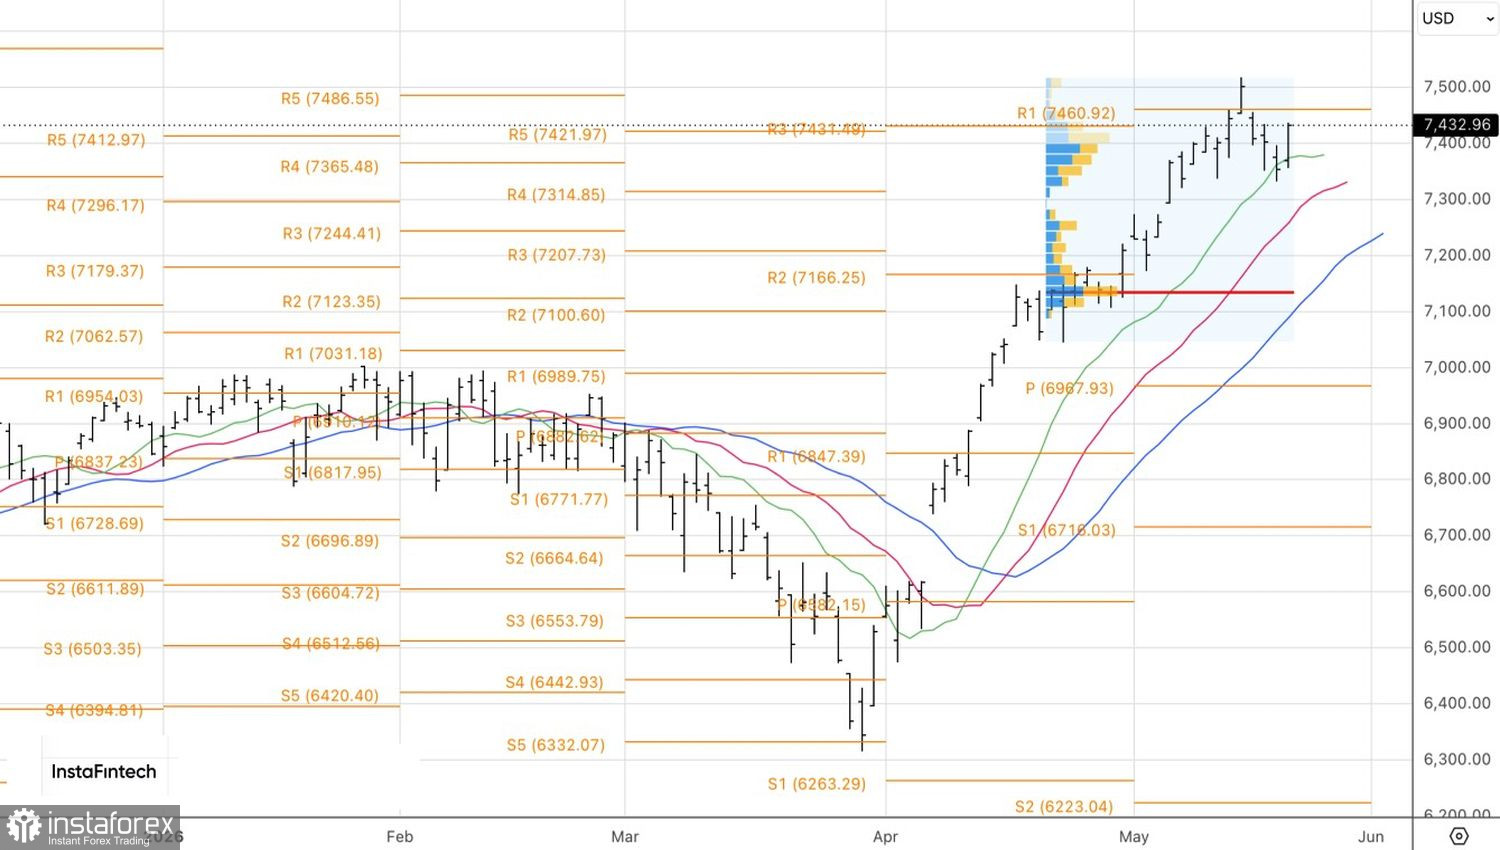
Technically, the daily chart shows that the S&P 500 bounced off a moving average and returned to the breakout-bar high. The next key test is the pivot at 7,460. Its breakout would generate a buy signal, while a retreat would favor selling.
*这里的市场分析是为了增加您对市场的了解,而不是给出交易的指示。
InstaSpot分析评论将让您充分了解市场趋势! 作为InstaSpot的客户,您将获得大量的免费服务以实现有效的交易。


