


Nella nostra squadra ci sono più di 7.000.000 trader! Ogni giorno ci impegniamo a far sì che il trading migliori. Conseguiamo grandi risultati e ci muoviamo in avanti.
Il riconoscimento da parte di milioni di trader in tutto il mondo rappresenta l'alta valutazione della nostra attività! Voi avete fatto la vostra scelta e noi faremo la nostra al fine di soddisfare le vostre aspettative!
Assieme siamo una grande squadra!
InstaSpot. Siamo orgogliosi di lavorare per voi!


Attore, campione del mondo di lotta libera e semplicemente un vero maciste russo! Persona venuta dal nulla. Persona che rispecchia i nostri obiettivi. Il segreto del successo di Taktarov consiste nel mirare continuamente al suo scopo.
Dischiudi anche tu tutti gli aspetti del tuo talento! Impara, prova, sbaglia, ma non fermarti!
InstaSpot - la storia delle tue vittorie inizia qui!

The EUR/USD currency pair aimed to continue its upward movement and break out of the sideways channel between 1.1657 and 1.1760 on Friday, but was unable to do so. The day started fairly well for the euro. The market was clearly pleased that inflation in the Eurozone continues to accelerate and that the European Central Bank is considering tightening monetary policy in the summer, unlike the Federal Reserve. However, as the evening approached, news broke that Donald Trump rejected yet another Iranian proposal for a peaceful resolution to the conflict in the Middle East, raising the chances of at least a prolonged blockade of the Strait of Hormuz. Military actions in the Middle East are unlikely to resume, though the possibility remains. However, maintaining the blockade is a significant negative factor for the entire world. The dollar is unlikely to benefit from this factor in the long term, but on Friday, it provided some support.
From a technical perspective, the hourly timeframe continues to show a new downward trend, but the pair has failed to hold below the 1.1657-1.1666 area for more than a week. We believe that the downward trend may continue only if a full-scale war resumes in the Middle East. The central banks, as expected, supported the euro and the pound, not the dollar.
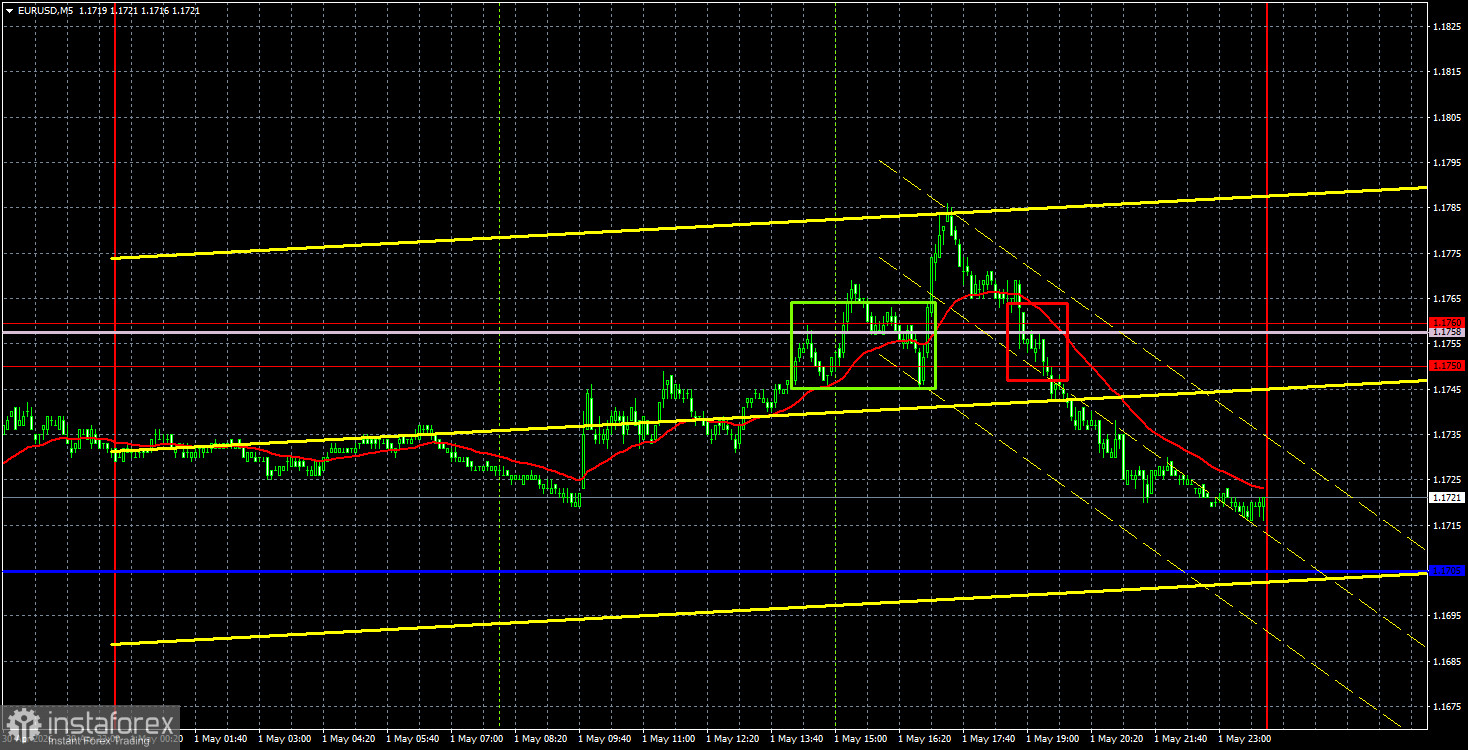
On the 5-minute timeframe, two trading signals were formed on Friday, both during the US trading session. First, the pair traded above the 1.1750-1.1760 range, then dropped back below it. The first signal proved false, but the second allowed traders to recover their losses from the first trade.
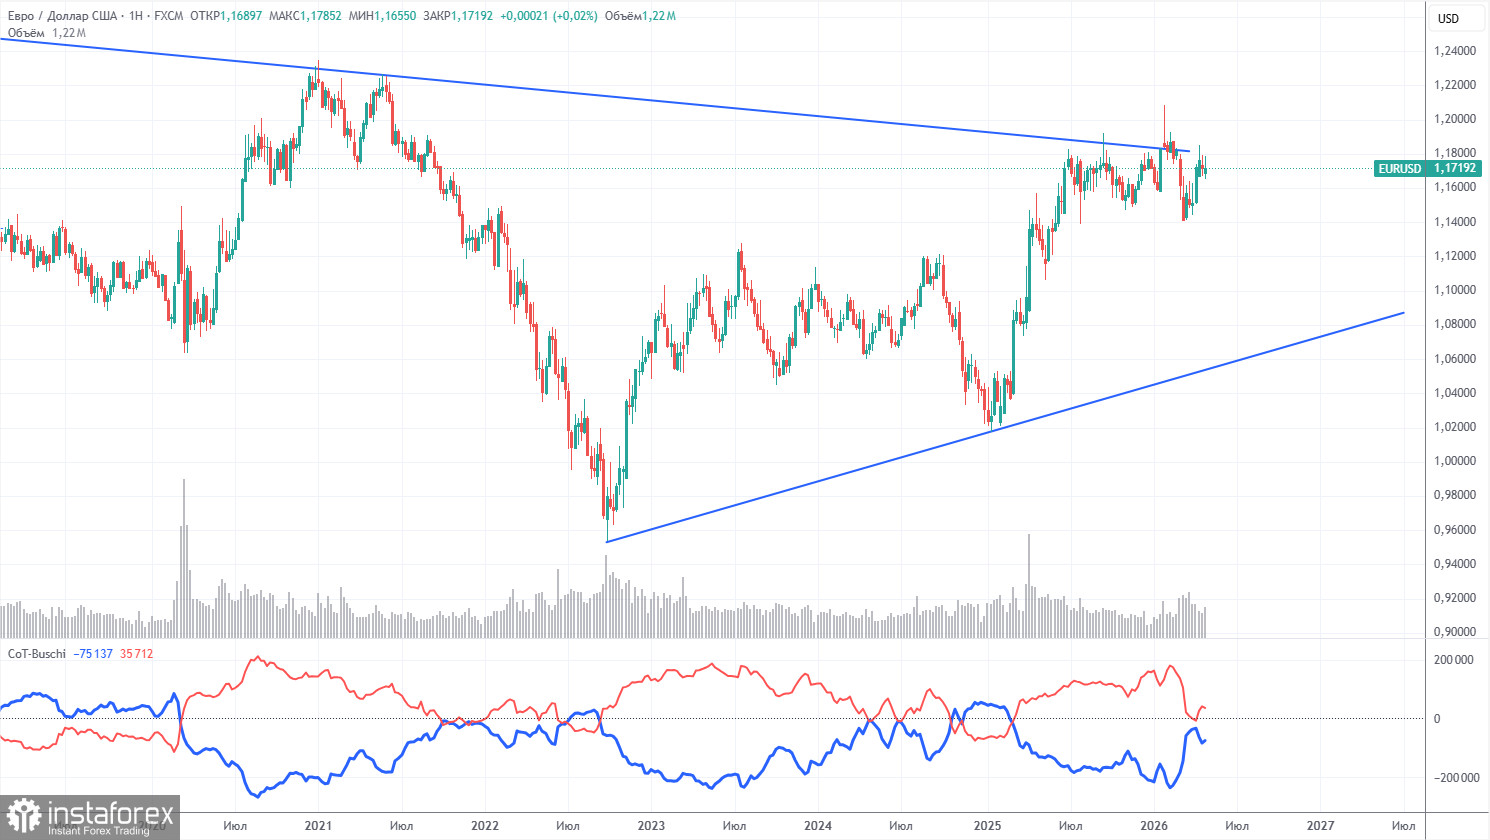
The latest COT report is dated April 28. On the weekly timeframe chart, it is evident that the net position of non-commercial traders remains "bullish," but is rapidly declining amid geopolitical events. Traders have been shedding European currency in favor of the US dollar in recent months. Trump's policies have not changed, but the dollar has served as a sort of "reserve currency" for a while. However, this process may already be behind us.
We still do not see any fundamental factors that would strengthen the euro, whereas there are still enough factors for the US dollar to decline. The war in the Middle East made the dollar temporarily super attractive, but when this factor expires, things will revert to the way they were. And that time may have already passed. In the long term, the euro may fall to the level of 1.06 (trend line), but the upward trend will still remain relevant. Right now, the pair has not strayed too far from the downward trend line, which has been breached several times.
The positioning of the red and blue lines of the indicator indicates parity between bulls and bears. Over the last reporting week, the number of long positions in the "non-commercial" group decreased by 300, while the number of shorts increased by 5,300. Consequently, the net position fell by 5,600 contracts over the week.
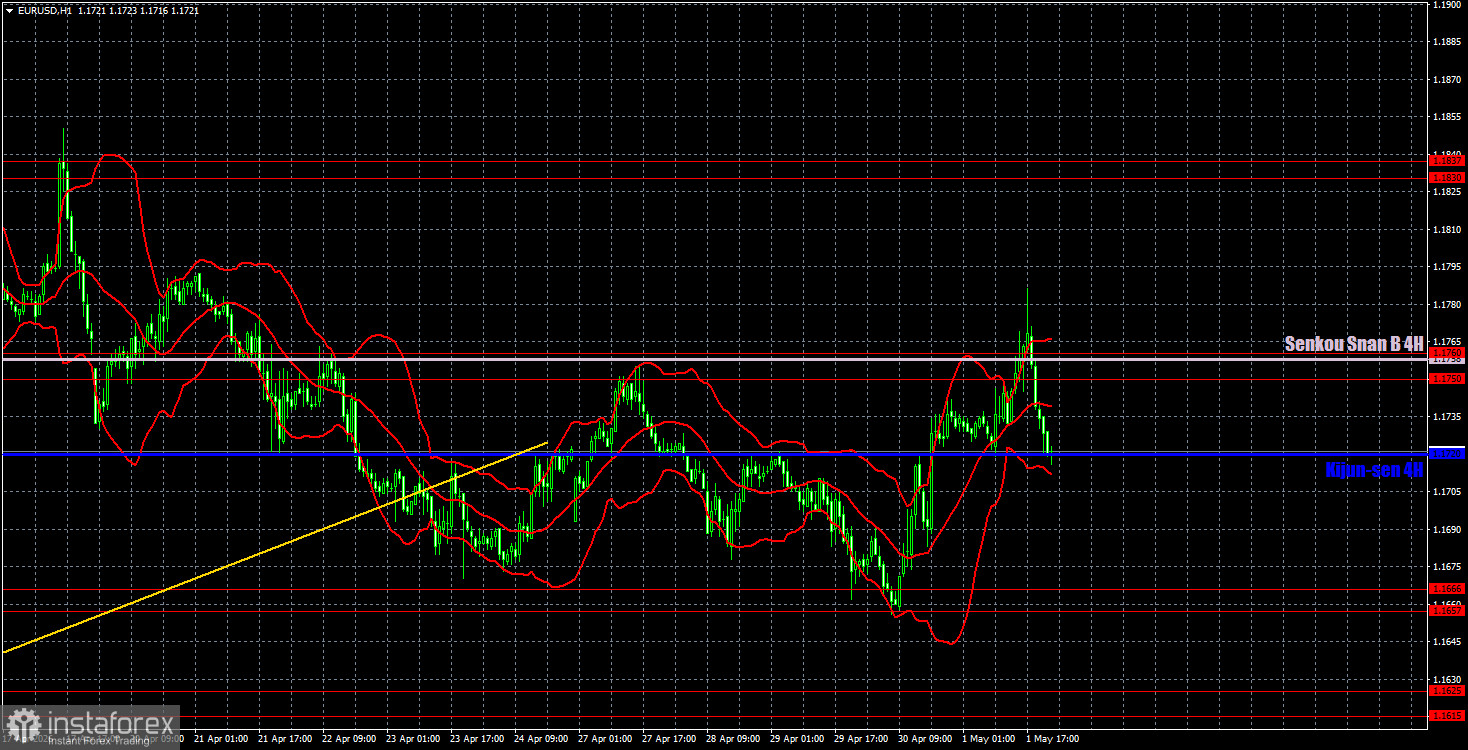
On the hourly timeframe, the EUR/USD pair has begun to form a downward trend. The situation in the Middle East remains tense, but it is not deteriorating, which means there are currently few strong reasons for the US dollar to further strengthen. Technically, the dollar is in a more advantageous position than the euro, but this advantage was not realized last week.
For May 4, we highlight the following trading levels: 1.1362, 1.1426, 1.1542, 1.1615-1.1625, 1.1657-1.1666, 1.1750-1.1760, 1.1830-1.1837, 1.1907-1.1922, as well as the Senkou Span B line (1.1758) and the Kijun-sen line (1.1720). The Ichimoku indicator lines may shift during the day, which should be considered when determining trading signals. Don't forget to set a stop loss to breakeven if the price moves in the correct direction by 15 pips. This will protect against potential losses if the signal turns out to be false.
On Monday, the only significant macroeconomic event is expected to be ECB President Christine Lagarde's speech. However, this event is only conditionally significant. Last week, the ECB meeting took place, and the markets have already received all the necessary information. Therefore, it is unlikely that Lagarde will surprise traders just a few days after the meeting.
Today, traders can open short positions if the price consolidates below the Kijun-sen line with the target area of 1.1657-1.1666. Long positions can be opened if the price rebounds from the critical line, targeting 1.1750-1.1760.
*La presente analisi del mercato ha un carattere esclusivamente informativo e non rappresenta una guida per l`effettuazione di una transazione.
Le recensioni analitiche di InstaSpot ti renderanno pienamente consapevole delle tendenze del mercato! Essendo un cliente InstaSpot, ti viene fornito un gran numero di servizi gratuiti per il trading efficiente.


