


La leggenda nel team InstaSpot!!
Legenda! Pensi che sia troppo patetico? Ma come dobbiamo chiamare un uomo, che è diventato il primo dell'Asia a vincere il campionato mondiale di scacchi a 18 anni e che è diventato il primo Gran Maestro indiano a 19? Fu l'inizio di un duro cammino verso il titolo di campione del mondo, l'uomo che divenne per sempre una parte della storia di scacchi. Un'altra leggenda nel team InstaSpot!


Il Borussia è una delle squadre di calcio più titolate in Germania, che ha ripetutamente dimostrato ai tifosi che lo spirito di competizione e leadership porta al successo. Fai trading nello stesso modo in cui lo fanno i professionisti dello sport - fiduciosamente e attivamente. Segui il Borussia FC e sii avanti con InstaSpot!

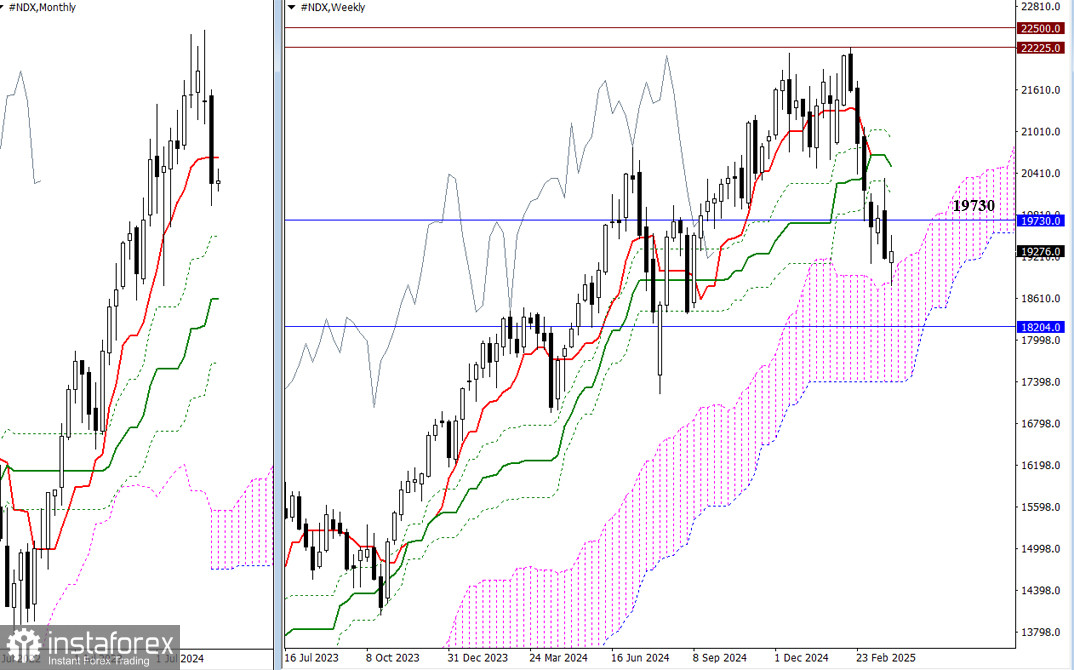
March concluded with a bearish candle that left a notable mark in the history books. Bears closed below the monthly short-term trend level (19,730) and eliminated the weekly golden cross, testing support at the upper boundary of the weekly Ichimoku cloud (18,821). If the decline continues, bearish targets will include testing and breaking through the next monthly support level (18,204) and exiting the weekly cloud (17,408). Should the bulls regain control by reclaiming the monthly short-term trend (19,730), they will aim to retest the levels of the weekly Ichimoku cross (20,103 – 20,508 – 20,914). Consolidation above these resistance levels will open the door for testing and updating the all-time high (22,225).
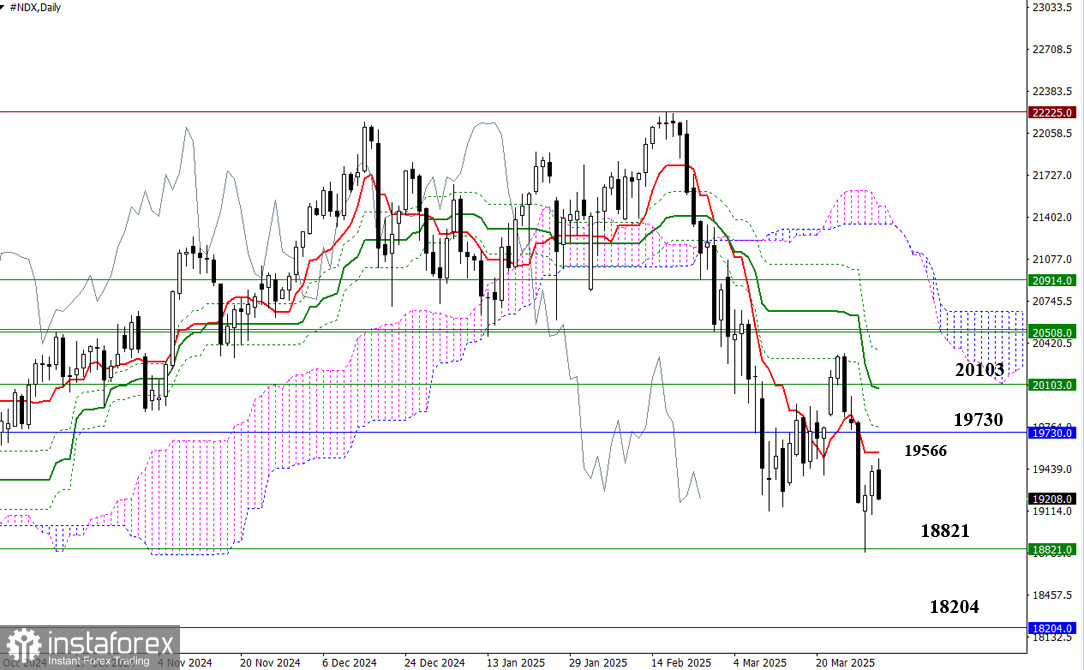
There is currently a downtrend occurring on the daily timeframe, but a corrective move has emerged and aims to test the first key level of the daily correction, which today lies at 19,566 (Tenkan-sen). Additional resistance levels are located at 19,730 – 19,765 – 20,065 – 20,103. A completed corrective climb followed by a drop below the corrective zone (18,792) will confirm a consolidation within the weekly cloud (18,821). The next downward target will be the monthly support at 18,204.
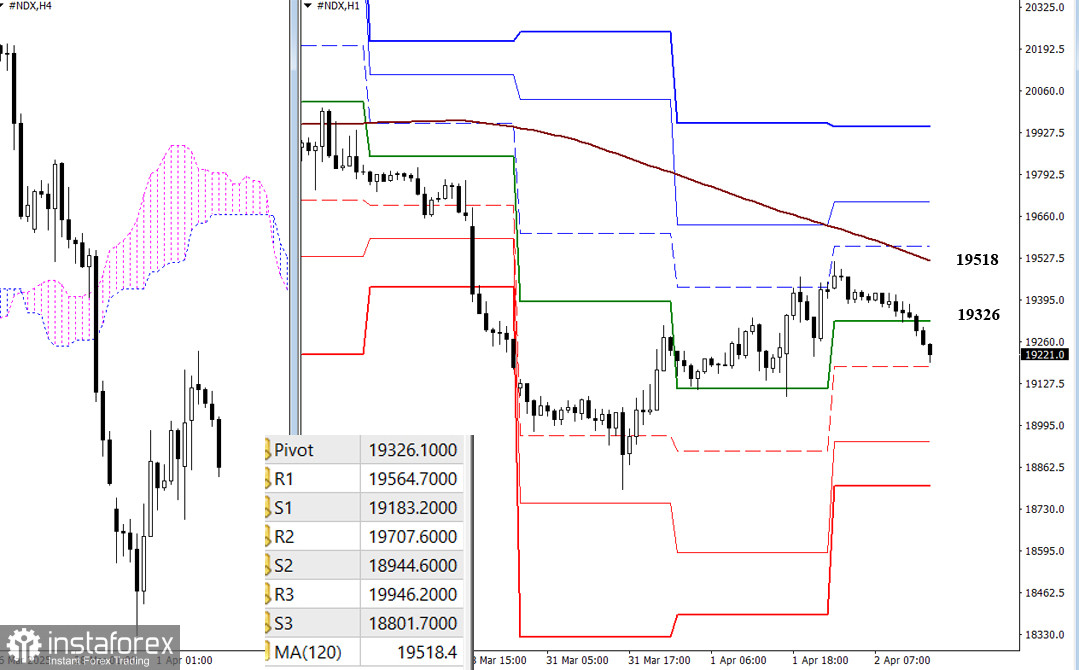
In the lower timeframes, the market is also in the corrective zone, and the main boundary on the way of bulls is the weekly long-term trend (19518). The breakdown and reversal of the trend will allow us to consider new upward benchmarks. The resistance of the classic Pivot levels (19565 - 19708 - 19946) will become these intraday targets. Completing the corrective rise and descent through the support of classic Pivot levels (19183 - 19945 - 18802) will allow an update on the minimum extreme of March (18792) and restore the downtrend.
***
*La presente analisi del mercato ha un carattere esclusivamente informativo e non rappresenta una guida per l`effettuazione di una transazione.
Le recensioni analitiche di InstaSpot ti renderanno pienamente consapevole delle tendenze del mercato! Essendo un cliente InstaSpot, ti viene fornito un gran numero di servizi gratuiti per il trading efficiente.


