


The legend in the InstaSpot team!
Legend! You think that's bombastic rhetoric? But how should we call a man, who became the first Asian to win the junior world chess championship at 18 and who became the first Indian Grandmaster at 19? That was the start of a hard path to the World Champion title for Viswanathan Anand, the man who became a part of history of chess forever. Now one more legend in the InstaSpot team!


Borussia is one of the most titled football clubs in Germany, which has repeatedly proved to fans: the spirit of competition and leadership will certainly lead to success. Trade in the same way that sports professionals play the game: confidently and actively. Keep a "pass" from Borussia FC and be in the lead with InstaSpot!

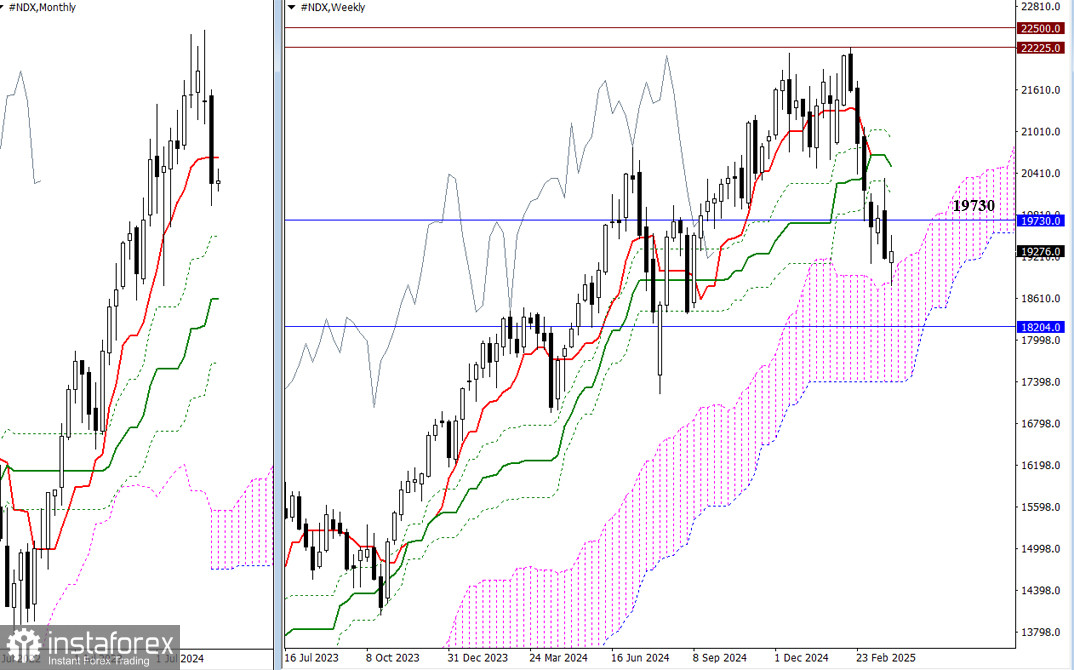
March concluded with a bearish candle that left a notable mark in the history books. Bears closed below the monthly short-term trend level (19,730) and eliminated the weekly golden cross, testing support at the upper boundary of the weekly Ichimoku cloud (18,821). If the decline continues, bearish targets will include testing and breaking through the next monthly support level (18,204) and exiting the weekly cloud (17,408). Should the bulls regain control by reclaiming the monthly short-term trend (19,730), they will aim to retest the levels of the weekly Ichimoku cross (20,103 – 20,508 – 20,914). Consolidation above these resistance levels will open the door for testing and updating the all-time high (22,225).
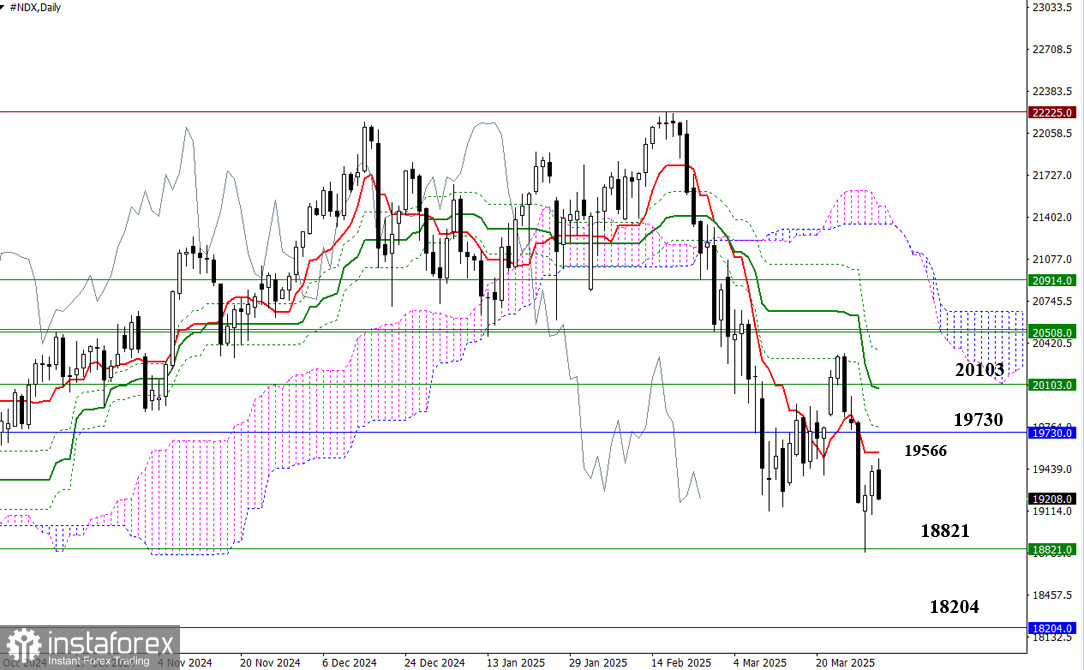
There is currently a downtrend occurring on the daily timeframe, but a corrective move has emerged and aims to test the first key level of the daily correction, which today lies at 19,566 (Tenkan-sen). Additional resistance levels are located at 19,730 – 19,765 – 20,065 – 20,103. A completed corrective climb followed by a drop below the corrective zone (18,792) will confirm a consolidation within the weekly cloud (18,821). The next downward target will be the monthly support at 18,204.
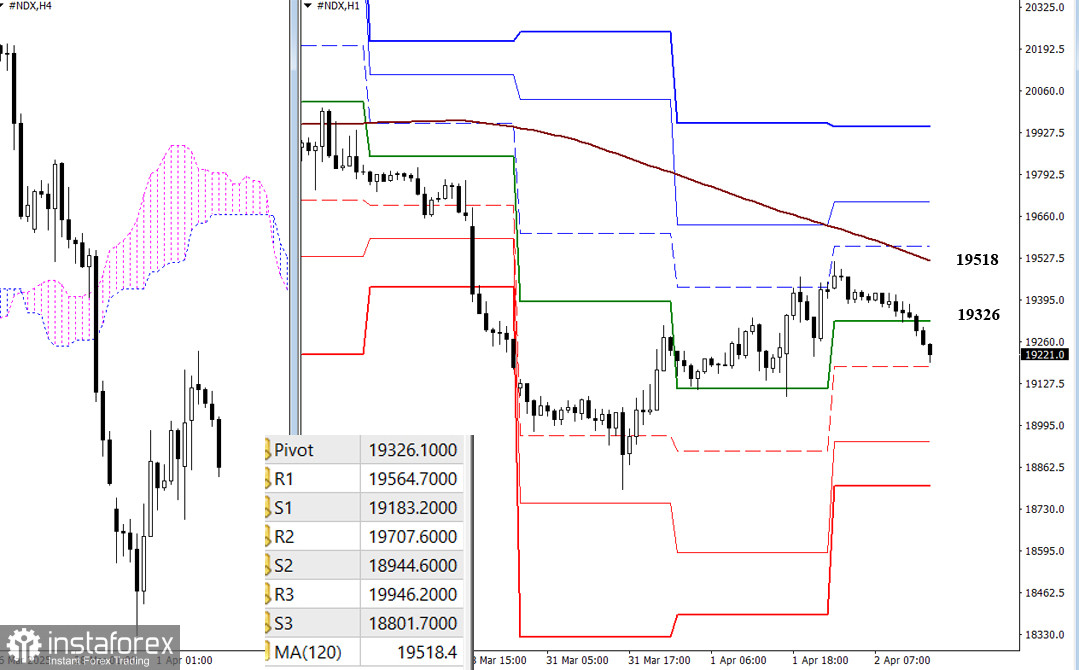
In the lower timeframes, the market is also in the corrective zone, and the main boundary on the way of bulls is the weekly long-term trend (19518). The breakdown and reversal of the trend will allow us to consider new upward benchmarks. The resistance of the classic Pivot levels (19565 - 19708 - 19946) will become these intraday targets. Completing the corrective rise and descent through the support of classic Pivot levels (19183 - 19945 - 18802) will allow an update on the minimum extreme of March (18792) and restore the downtrend.
***
*এখানে পোস্ট করা মার্কেট বিশ্লেষণ আপনার সচেতনতা বৃদ্ধির জন্য প্রদান করা হয়, ট্রেড করার নির্দেশনা প্রদানের জন্য প্রদান করা হয় না।
ইন্সটাফরেক্স বিশ্লেষণমূলক পর্যালোচনাগুলো আপনাকে মার্কেট প্রবণতা সম্পর্কে পুরোপুরি সচেতন করবে! ইন্সটাফরেক্সের একজন গ্রাহক হওয়ায়, দক্ষ ট্রেডিং এর জন্য আপনাকে অনেক সেবা বিনামূল্যে প্রদান করা হয়।


