


Tim kami memiliki lebih dari 7.000.000 trader!
Setiap harinya kami bekerja sama untuk meningkatkan trading. Kami memperoleh hasil tinggi dan terus bergerak maju.
Pengakuan dari jutaan trader diseluruh dunia merupakan apresiasi terbaik dari kerja kami! Anda membuat pilihan anda dan kami akan melakukan semua yang dibutuhkan untuk memenuhi ekspektasi anda!
We are a great team together!
InstaSpot. Bangga bekerja bersama anda!


Seorang Aktor, juara 6 turnamen UFC dan pahlawan sesungguhnya!
Pria yang berhasil. Pria yang berusaha keras.
Rahasia dibalik kesuksesan Taktarov adalah pergerakan konstan menuju target.
Tunjukkan seluruh sisi dari bakat anda!
Temukan, coba, gagal - namun jangan pernah berhenti!
InstaSpot. Cerita sukses anda dimulai disini!

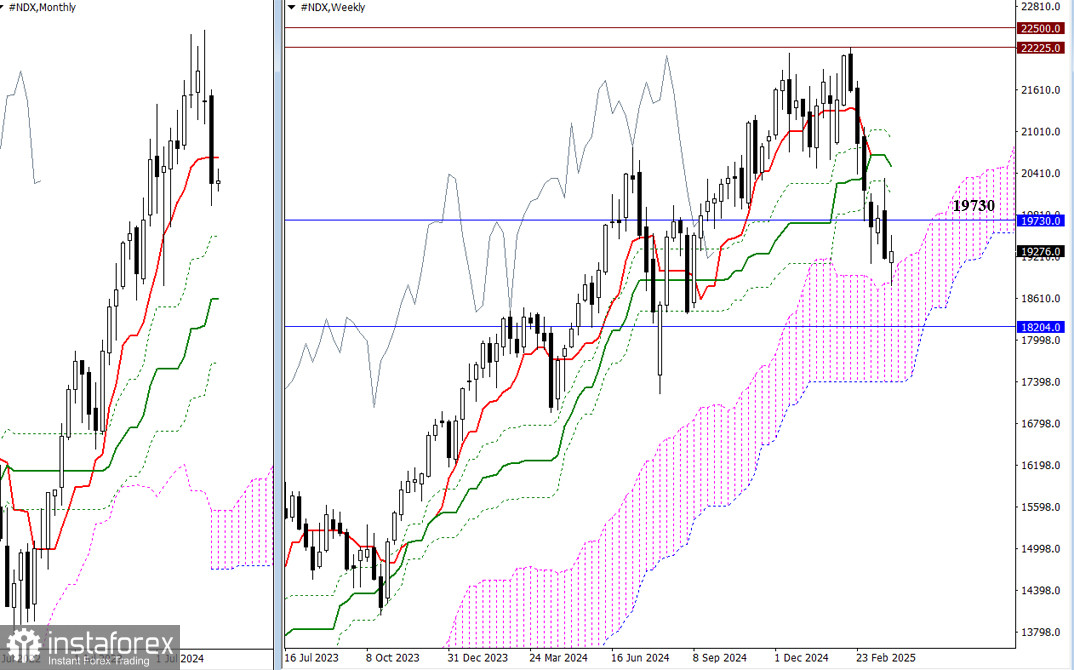
March concluded with a bearish candle that left a notable mark in the history books. Bears closed below the monthly short-term trend level (19,730) and eliminated the weekly golden cross, testing support at the upper boundary of the weekly Ichimoku cloud (18,821). If the decline continues, bearish targets will include testing and breaking through the next monthly support level (18,204) and exiting the weekly cloud (17,408). Should the bulls regain control by reclaiming the monthly short-term trend (19,730), they will aim to retest the levels of the weekly Ichimoku cross (20,103 – 20,508 – 20,914). Consolidation above these resistance levels will open the door for testing and updating the all-time high (22,225).
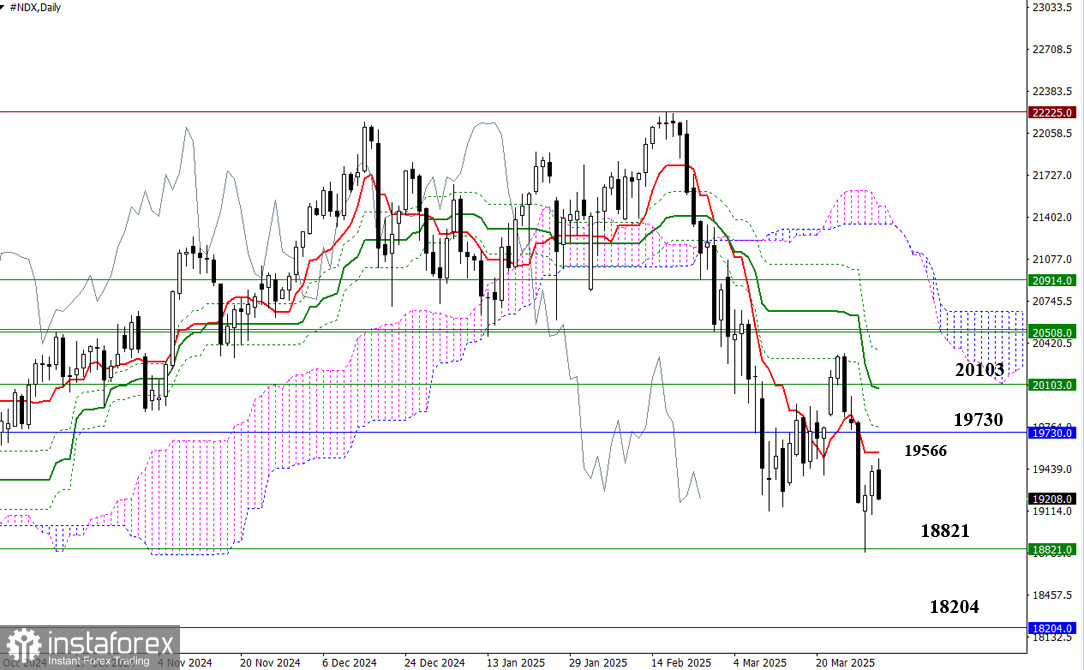
There is currently a downtrend occurring on the daily timeframe, but a corrective move has emerged and aims to test the first key level of the daily correction, which today lies at 19,566 (Tenkan-sen). Additional resistance levels are located at 19,730 – 19,765 – 20,065 – 20,103. A completed corrective climb followed by a drop below the corrective zone (18,792) will confirm a consolidation within the weekly cloud (18,821). The next downward target will be the monthly support at 18,204.
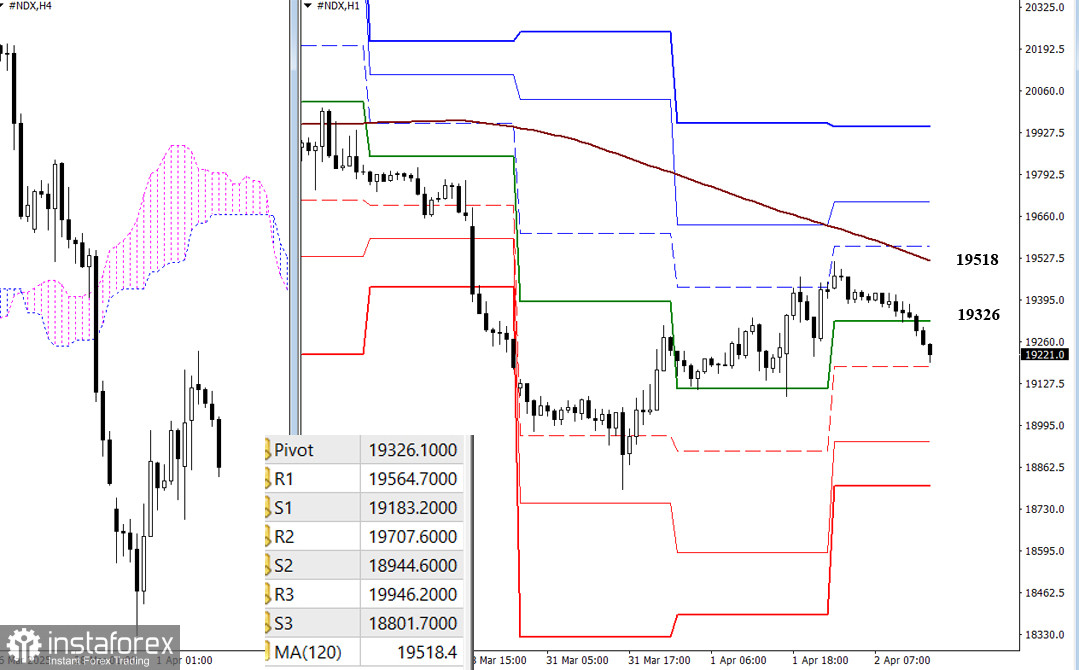
In the lower timeframes, the market is also in the corrective zone, and the main boundary on the way of bulls is the weekly long-term trend (19518). The breakdown and reversal of the trend will allow us to consider new upward benchmarks. The resistance of the classic Pivot levels (19565 - 19708 - 19946) will become these intraday targets. Completing the corrective rise and descent through the support of classic Pivot levels (19183 - 19945 - 18802) will allow an update on the minimum extreme of March (18792) and restore the downtrend.
***
*Analisis pasar yang diposting disini dimaksudkan untuk meningkatkan pengetahuan Anda namun tidak untuk memberi instruksi trading.
Tinjauan analitis InstaSpot akan membuat Anda menyadari sepenuhnya tren pasar! Sebagai klien InstaSpot, Anda dilengkapi dengan sejumlah besar layanan gratis untuk trading yang efisien.


