


Nella nostra squadra ci sono più di 7.000.000 trader! Ogni giorno ci impegniamo a far sì che il trading migliori. Conseguiamo grandi risultati e ci muoviamo in avanti.
Il riconoscimento da parte di milioni di trader in tutto il mondo rappresenta l'alta valutazione della nostra attività! Voi avete fatto la vostra scelta e noi faremo la nostra al fine di soddisfare le vostre aspettative!
Assieme siamo una grande squadra!
InstaSpot. Siamo orgogliosi di lavorare per voi!


Attore, campione del mondo di lotta libera e semplicemente un vero maciste russo! Persona venuta dal nulla. Persona che rispecchia i nostri obiettivi. Il segreto del successo di Taktarov consiste nel mirare continuamente al suo scopo.
Dischiudi anche tu tutti gli aspetti del tuo talento! Impara, prova, sbaglia, ma non fermarti!
InstaSpot - la storia delle tue vittorie inizia qui!

Trend-following analysis
In January, EUR/USD is expected to move higher from 1.0706, the level of closing the December one-month high, to the target at 1.0941, which is the 50.0% Fibonacci retracement level plotted by the red dotted line. Once this level is tested, the instrument will continue its rise to 1.1104, the historic resistance level plotted by the blue dotted line. After this level is tested, we could expect a downward retracement.
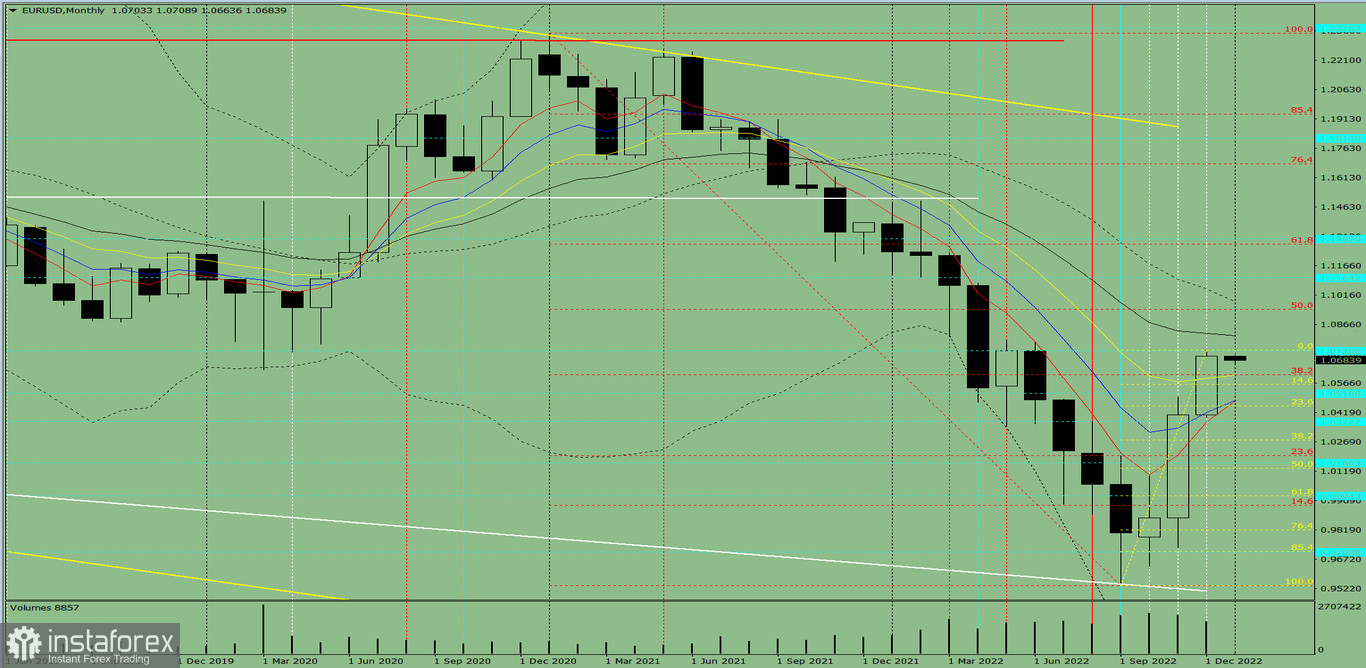
Picture 1, one-month chart
Indicator analysis
The conclusion from the complex analysis is that EUR/USD is likely to trade higher.
The one-month chart of EUR/USD draws traders to the conclusion that the overall trend is going to be bullish. The one-month white candlestick lacks the first lower shadow in the first week. The second upper shadow is also missing on the final week.
The basic scenario. EUR/USD is expected to move higher from 1.0706, the level of closing the December one-month candlestick, to the target at 1.0941, which is the 50.0% Fibonacci retracement level plotted by the red dotted line. Once this level is tested, the instrument will continue its rise to 1.1104, the historic resistance level plotted by the blue dotted line. After this level is tested, we could expect a downward retracement.
Alternative scenario. EUR/USD might also move higher from 1.0706, the level of closing the December one-month candlestick, towards the target of 1.0941, which is the 50.0% Fibonacci retracement level plotted by the red dotted line. After this level is tested, the price will retrace downwards. 1.0809 serves as a 21-period moving average plotted by the black thin line.
*La presente analisi del mercato ha un carattere esclusivamente informativo e non rappresenta una guida per l`effettuazione di una transazione.
Le recensioni analitiche di InstaSpot ti renderanno pienamente consapevole delle tendenze del mercato! Essendo un cliente InstaSpot, ti viene fornito un gran numero di servizi gratuiti per il trading efficiente.


