


Huyền thoại trong nhóm InstaSpot!
Huyền thoại! Bạn nghĩ rằng đó là lời nói khoa trương? Nhưng chúng ta nên gọi một người đàn ông như thế nào, người đã trở thành người châu Á đầu tiên giành chức vô địch cờ vua thế giới lứa tuổi thiếu niên năm 18 tuổi và người trở thành Đại kiện tướng Ấn Độ đầu tiên năm 19 tuổi? Đó là khởi đầu cho con đường khó khăn đến danh hiệu Vô địch Thế giới của Viswanathan Anand, người đàn ông đã trở thành một phần của lịch sử cờ vua mãi mãi. Giờ đây, một huyền thoại nữa trong nhóm InstaSpot!


Borussia là một trong những câu lạc bộ bóng đá danh giá nhất nước Đức, đã nhiều lần chứng minh cho người hâm mộ thấy: tinh thần thi đấu và sự lãnh đạo chắc chắn sẽ dẫn đến thành công. Giao dịch theo cách mà các chuyên gia thể thao chơi trò chơi: tự tin và chủ động. Giữ một "đường chuyền" từ Borussia FC và dẫn đầu với InstaSpot!
Trend-following analysis
In January, EUR/USD is expected to move higher from 1.0706, the level of closing the December one-month high, to the target at 1.0941, which is the 50.0% Fibonacci retracement level plotted by the red dotted line. Once this level is tested, the instrument will continue its rise to 1.1104, the historic resistance level plotted by the blue dotted line. After this level is tested, we could expect a downward retracement.
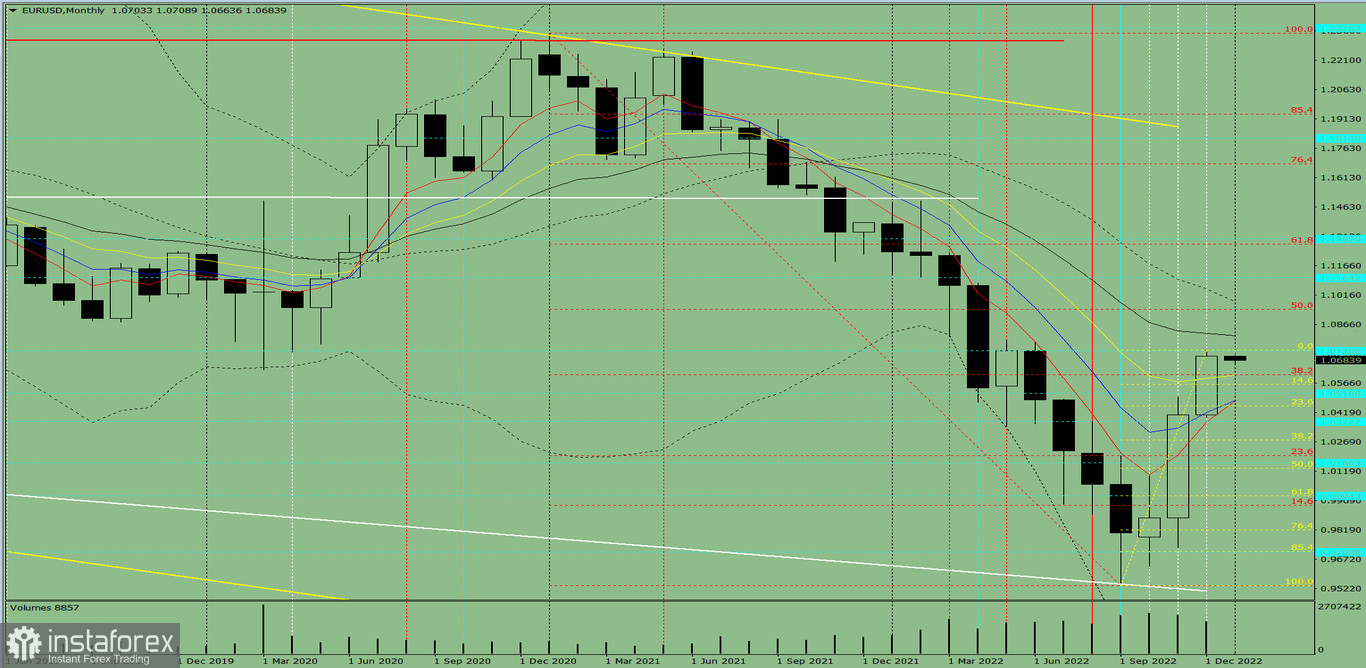
Picture 1, one-month chart
Indicator analysis
The conclusion from the complex analysis is that EUR/USD is likely to trade higher.
The one-month chart of EUR/USD draws traders to the conclusion that the overall trend is going to be bullish. The one-month white candlestick lacks the first lower shadow in the first week. The second upper shadow is also missing on the final week.
The basic scenario. EUR/USD is expected to move higher from 1.0706, the level of closing the December one-month candlestick, to the target at 1.0941, which is the 50.0% Fibonacci retracement level plotted by the red dotted line. Once this level is tested, the instrument will continue its rise to 1.1104, the historic resistance level plotted by the blue dotted line. After this level is tested, we could expect a downward retracement.
Alternative scenario. EUR/USD might also move higher from 1.0706, the level of closing the December one-month candlestick, towards the target of 1.0941, which is the 50.0% Fibonacci retracement level plotted by the red dotted line. After this level is tested, the price will retrace downwards. 1.0809 serves as a 21-period moving average plotted by the black thin line.
*Phân tích thị trường được đăng tải ở đây có nghĩa là để gia tăng nhận thức của bạn, nhưng không đưa ra các chỉ dẫn để thực hiện một giao dịch.
InstaSpot analytical reviews will make you fully aware of market trends! Being an InstaSpot client, you are provided with a large number of free services for efficient trading.


