


The legend in the InstaSpot team!
Legend! You think that's bombastic rhetoric? But how should we call a man, who became the first Asian to win the junior world chess championship at 18 and who became the first Indian Grandmaster at 19? That was the start of a hard path to the World Champion title for Viswanathan Anand, the man who became a part of history of chess forever. Now one more legend in the InstaSpot team!


Borussia is one of the most titled football clubs in Germany, which has repeatedly proved to fans: the spirit of competition and leadership will certainly lead to success. Trade in the same way that sports professionals play the game: confidently and actively. Keep a "pass" from Borussia FC and be in the lead with InstaSpot!
Trend-following analysis
In January, EUR/USD is expected to move higher from 1.0706, the level of closing the December one-month high, to the target at 1.0941, which is the 50.0% Fibonacci retracement level plotted by the red dotted line. Once this level is tested, the instrument will continue its rise to 1.1104, the historic resistance level plotted by the blue dotted line. After this level is tested, we could expect a downward retracement.
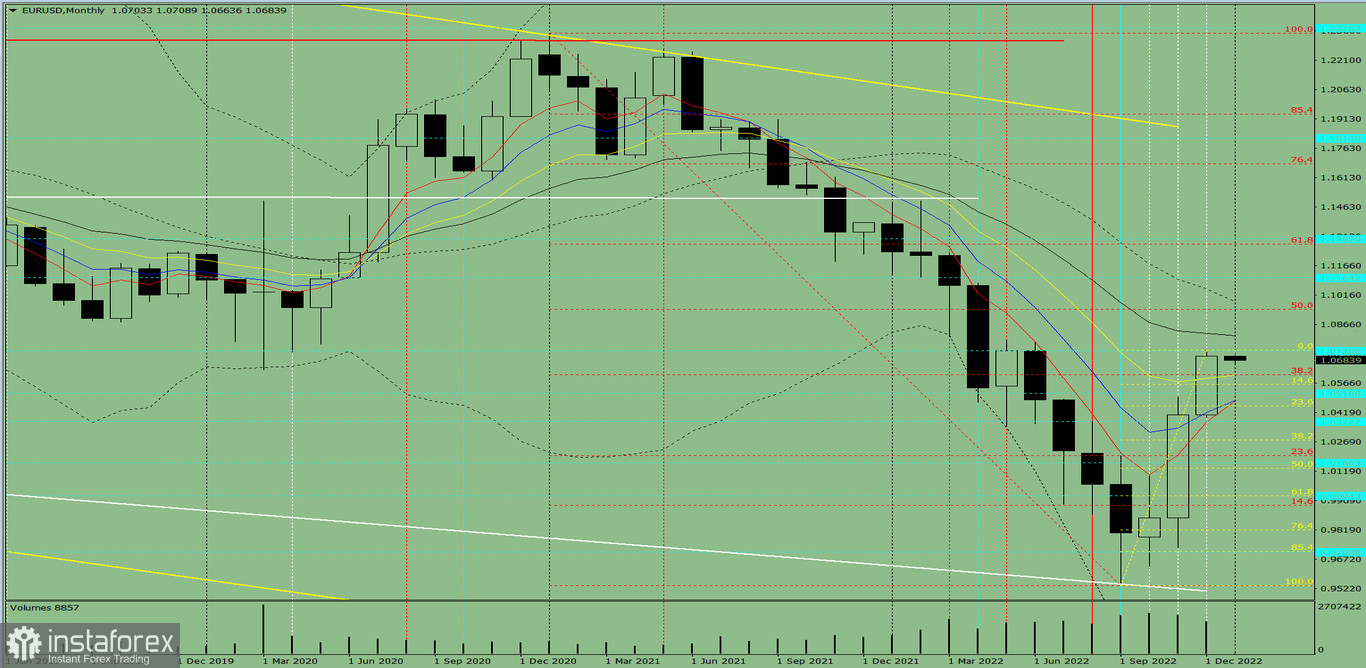
Picture 1, one-month chart
Indicator analysis
The conclusion from the complex analysis is that EUR/USD is likely to trade higher.
The one-month chart of EUR/USD draws traders to the conclusion that the overall trend is going to be bullish. The one-month white candlestick lacks the first lower shadow in the first week. The second upper shadow is also missing on the final week.
The basic scenario. EUR/USD is expected to move higher from 1.0706, the level of closing the December one-month candlestick, to the target at 1.0941, which is the 50.0% Fibonacci retracement level plotted by the red dotted line. Once this level is tested, the instrument will continue its rise to 1.1104, the historic resistance level plotted by the blue dotted line. After this level is tested, we could expect a downward retracement.
Alternative scenario. EUR/USD might also move higher from 1.0706, the level of closing the December one-month candlestick, towards the target of 1.0941, which is the 50.0% Fibonacci retracement level plotted by the red dotted line. After this level is tested, the price will retrace downwards. 1.0809 serves as a 21-period moving average plotted by the black thin line.
*这里的市场分析是为了增加您对市场的了解,而不是给出交易的指示。
InstaSpot分析评论将让您充分了解市场趋势! 作为InstaSpot的客户,您将获得大量的免费服务以实现有效的交易。


