


Nella nostra squadra ci sono più di 7.000.000 trader! Ogni giorno ci impegniamo a far sì che il trading migliori. Conseguiamo grandi risultati e ci muoviamo in avanti.
Il riconoscimento da parte di milioni di trader in tutto il mondo rappresenta l'alta valutazione della nostra attività! Voi avete fatto la vostra scelta e noi faremo la nostra al fine di soddisfare le vostre aspettative!
Assieme siamo una grande squadra!
InstaSpot. Siamo orgogliosi di lavorare per voi!


Attore, campione del mondo di lotta libera e semplicemente un vero maciste russo! Persona venuta dal nulla. Persona che rispecchia i nostri obiettivi. Il segreto del successo di Taktarov consiste nel mirare continuamente al suo scopo.
Dischiudi anche tu tutti gli aspetti del tuo talento! Impara, prova, sbaglia, ma non fermarti!
InstaSpot - la storia delle tue vittorie inizia qui!

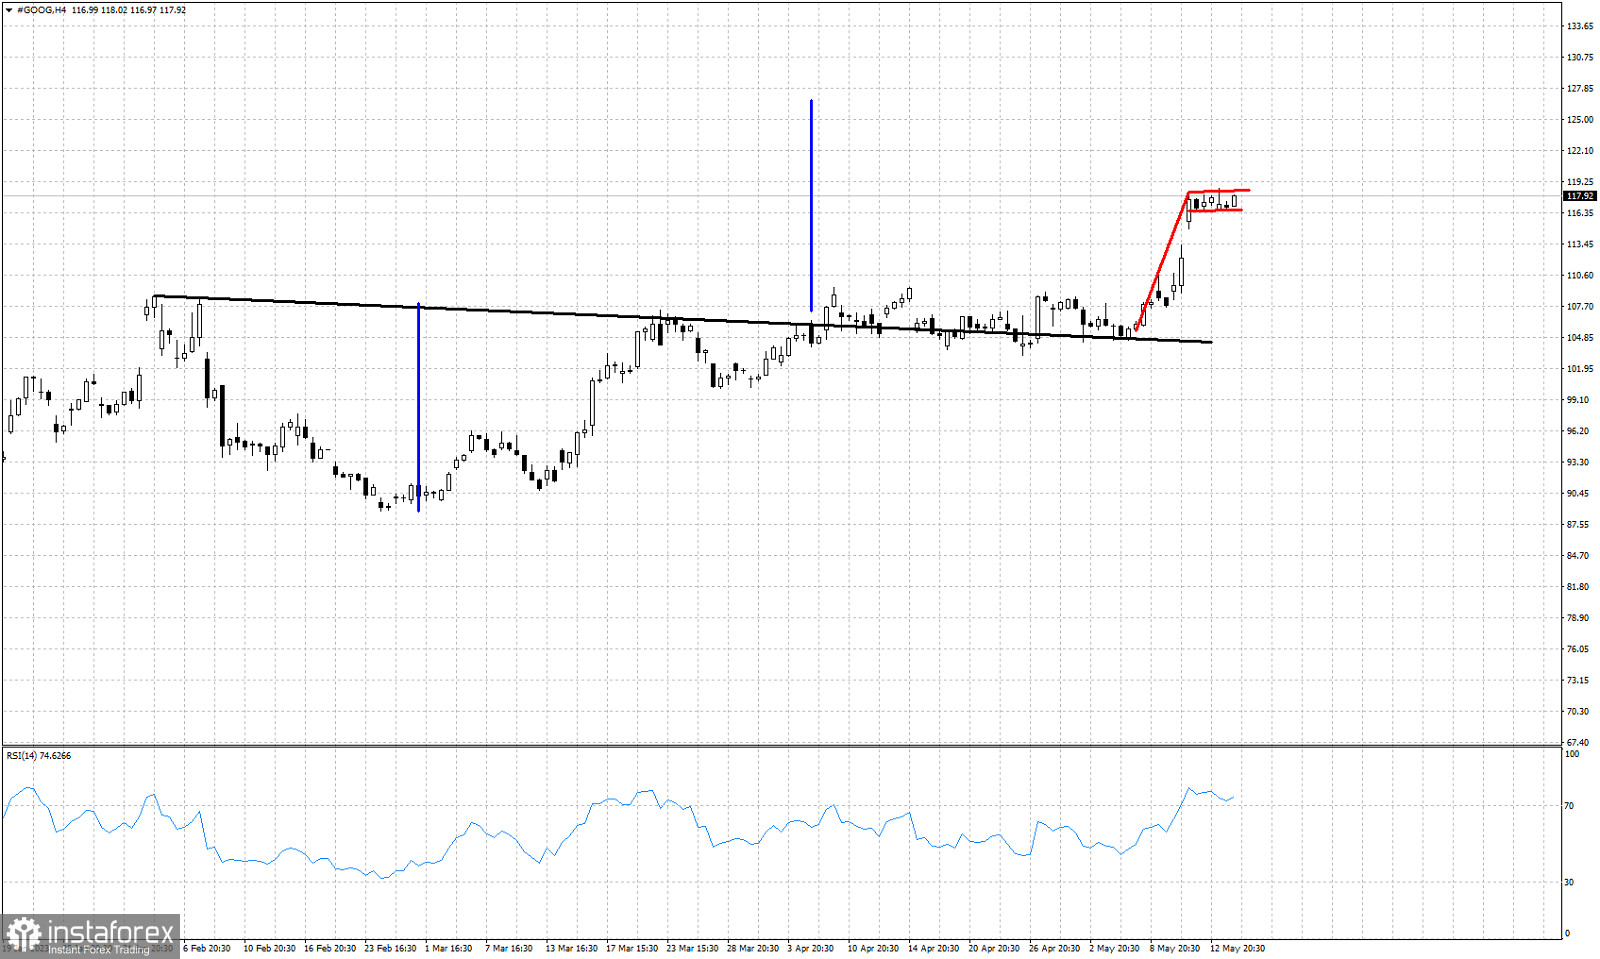
Black line -resistance
Blue lines- expected rise equal to height of cup
Red lines- bullish flag
At the beginning of April we discussed the bullish breakout of a cup and handle pattern in GOOG stock chart. Although price broke above the then recent high, price did not make any real progress until the last few days. Price continues to trade around the neck line resistance and at the beginning of May price broke out above it. Recent price action shows us that a bullish flag pattern has been formed. A break above $118.25 would be a new bullish signal. According to the cup and handle pattern there is plenty of upside potential for GOOG stock price towards $127. A bullish flag break out will be supportive of this scenario. Bulls do not want to see GOOG stock price fall below $105.
*La presente analisi del mercato ha un carattere esclusivamente informativo e non rappresenta una guida per l`effettuazione di una transazione.
Le recensioni analitiche di InstaSpot ti renderanno pienamente consapevole delle tendenze del mercato! Essendo un cliente InstaSpot, ti viene fornito un gran numero di servizi gratuiti per il trading efficiente.


