


The legend in the InstaSpot team!
Legend! You think that's bombastic rhetoric? But how should we call a man, who became the first Asian to win the junior world chess championship at 18 and who became the first Indian Grandmaster at 19? That was the start of a hard path to the World Champion title for Viswanathan Anand, the man who became a part of history of chess forever. Now one more legend in the InstaSpot team!


Borussia is one of the most titled football clubs in Germany, which has repeatedly proved to fans: the spirit of competition and leadership will certainly lead to success. Trade in the same way that sports professionals play the game: confidently and actively. Keep a "pass" from Borussia FC and be in the lead with InstaSpot!
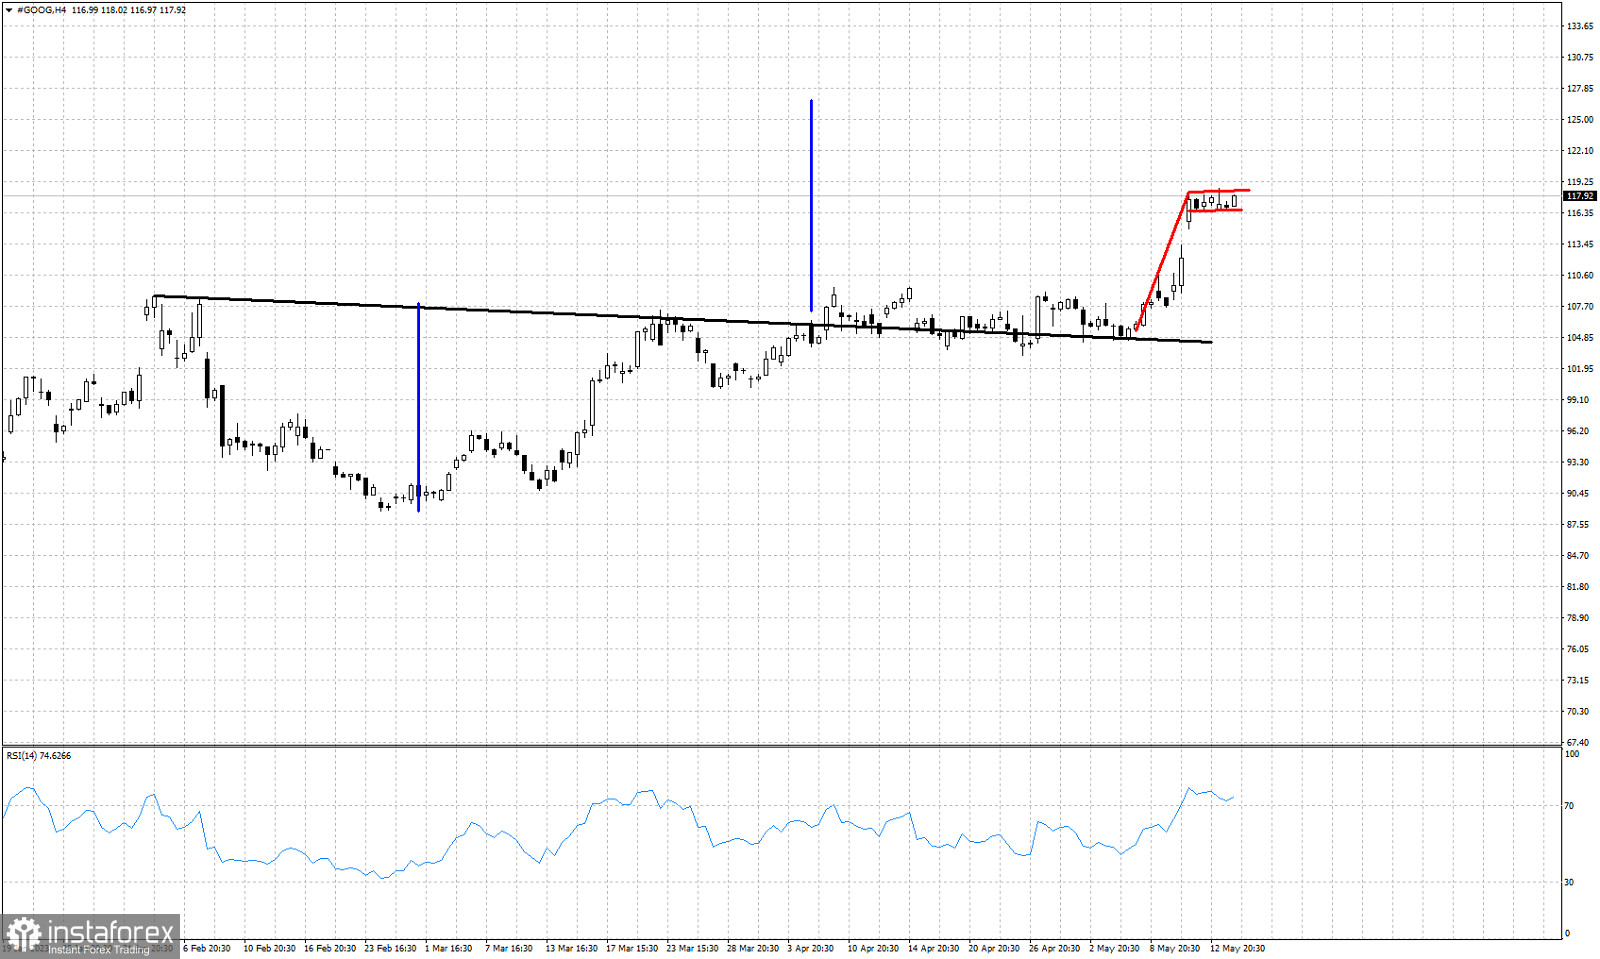
Black line -resistance
Blue lines- expected rise equal to height of cup
Red lines- bullish flag
At the beginning of April we discussed the bullish breakout of a cup and handle pattern in GOOG stock chart. Although price broke above the then recent high, price did not make any real progress until the last few days. Price continues to trade around the neck line resistance and at the beginning of May price broke out above it. Recent price action shows us that a bullish flag pattern has been formed. A break above $118.25 would be a new bullish signal. According to the cup and handle pattern there is plenty of upside potential for GOOG stock price towards $127. A bullish flag break out will be supportive of this scenario. Bulls do not want to see GOOG stock price fall below $105.
*这里的市场分析是为了增加您对市场的了解,而不是给出交易的指示。
InstaSpot分析评论将让您充分了解市场趋势! 作为InstaSpot的客户,您将获得大量的免费服务以实现有效的交易。


