


Tim kami memiliki lebih dari 7.000.000 trader!
Setiap harinya kami bekerja sama untuk meningkatkan trading. Kami memperoleh hasil tinggi dan terus bergerak maju.
Pengakuan dari jutaan trader diseluruh dunia merupakan apresiasi terbaik dari kerja kami! Anda membuat pilihan anda dan kami akan melakukan semua yang dibutuhkan untuk memenuhi ekspektasi anda!
We are a great team together!
InstaSpot. Bangga bekerja bersama anda!


Seorang Aktor, juara 6 turnamen UFC dan pahlawan sesungguhnya!
Pria yang berhasil. Pria yang berusaha keras.
Rahasia dibalik kesuksesan Taktarov adalah pergerakan konstan menuju target.
Tunjukkan seluruh sisi dari bakat anda!
Temukan, coba, gagal - namun jangan pernah berhenti!
InstaSpot. Cerita sukses anda dimulai disini!

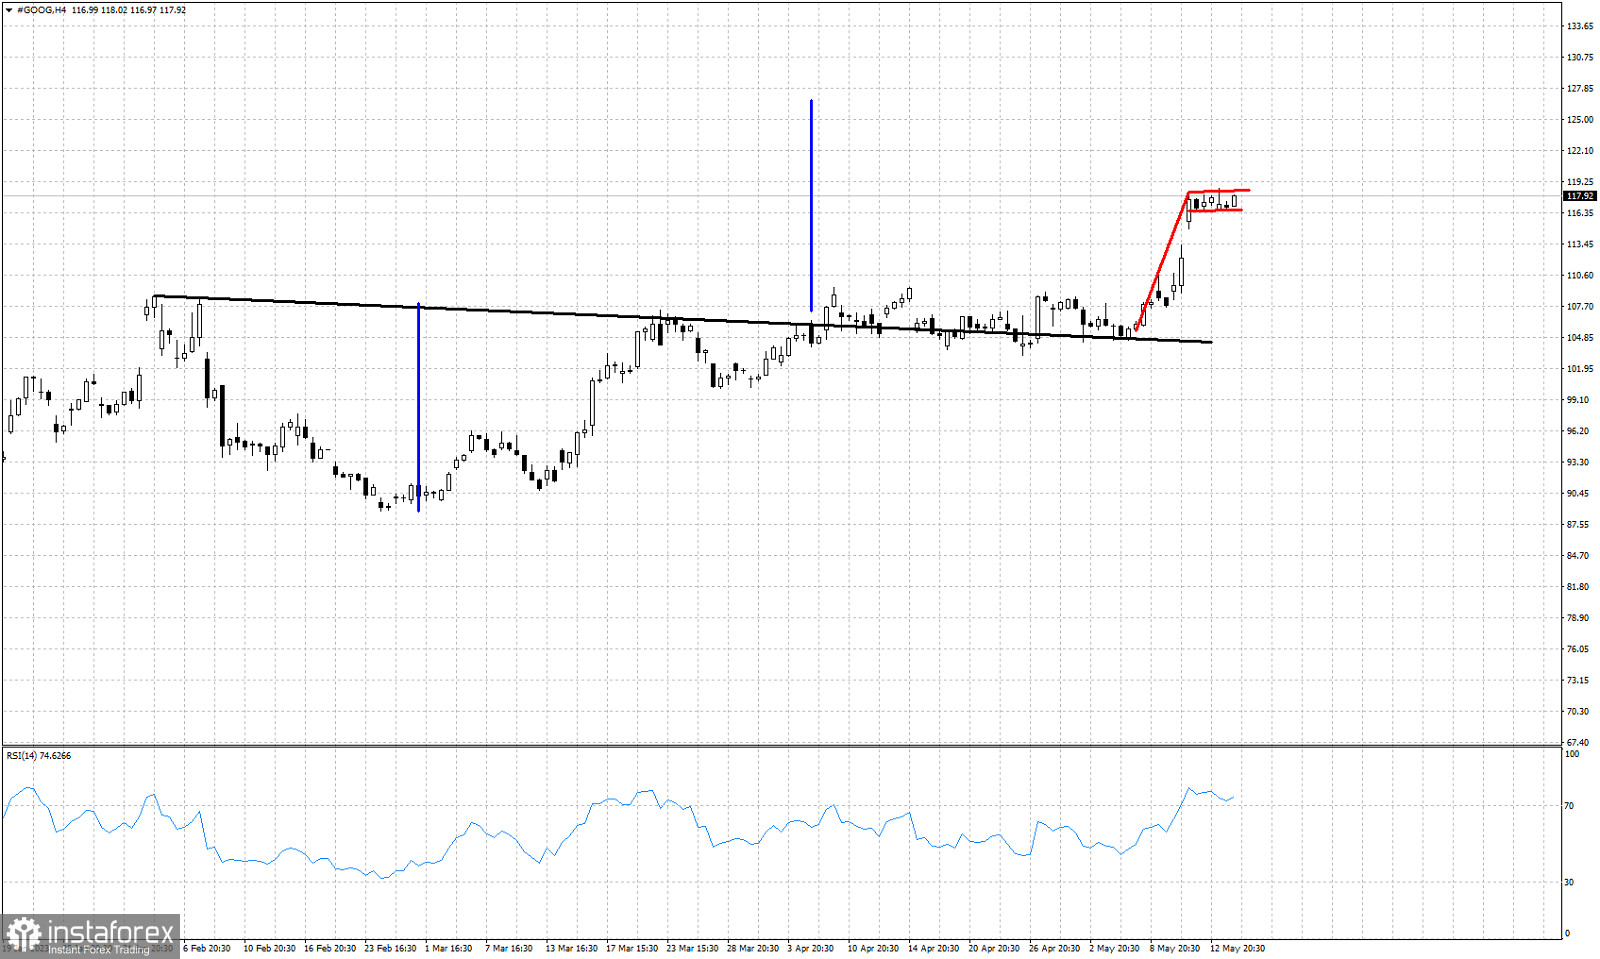
Black line -resistance
Blue lines- expected rise equal to height of cup
Red lines- bullish flag
At the beginning of April we discussed the bullish breakout of a cup and handle pattern in GOOG stock chart. Although price broke above the then recent high, price did not make any real progress until the last few days. Price continues to trade around the neck line resistance and at the beginning of May price broke out above it. Recent price action shows us that a bullish flag pattern has been formed. A break above $118.25 would be a new bullish signal. According to the cup and handle pattern there is plenty of upside potential for GOOG stock price towards $127. A bullish flag break out will be supportive of this scenario. Bulls do not want to see GOOG stock price fall below $105.
*Analisis pasar yang diposting disini dimaksudkan untuk meningkatkan pengetahuan Anda namun tidak untuk memberi instruksi trading.
Tinjauan analitis InstaSpot akan membuat Anda menyadari sepenuhnya tren pasar! Sebagai klien InstaSpot, Anda dilengkapi dengan sejumlah besar layanan gratis untuk trading yang efisien.


