


La leggenda nel team InstaSpot!!
Legenda! Pensi che sia troppo patetico? Ma come dobbiamo chiamare un uomo, che è diventato il primo dell'Asia a vincere il campionato mondiale di scacchi a 18 anni e che è diventato il primo Gran Maestro indiano a 19? Fu l'inizio di un duro cammino verso il titolo di campione del mondo, l'uomo che divenne per sempre una parte della storia di scacchi. Un'altra leggenda nel team InstaSpot!


Il Borussia è una delle squadre di calcio più titolate in Germania, che ha ripetutamente dimostrato ai tifosi che lo spirito di competizione e leadership porta al successo. Fai trading nello stesso modo in cui lo fanno i professionisti dello sport - fiduciosamente e attivamente. Segui il Borussia FC e sii avanti con InstaSpot!

Monday is traditionally accompanied by an empty macroeconomic calendar. Important statistics in Europe, the United Kingdom, and the United States are not expected.
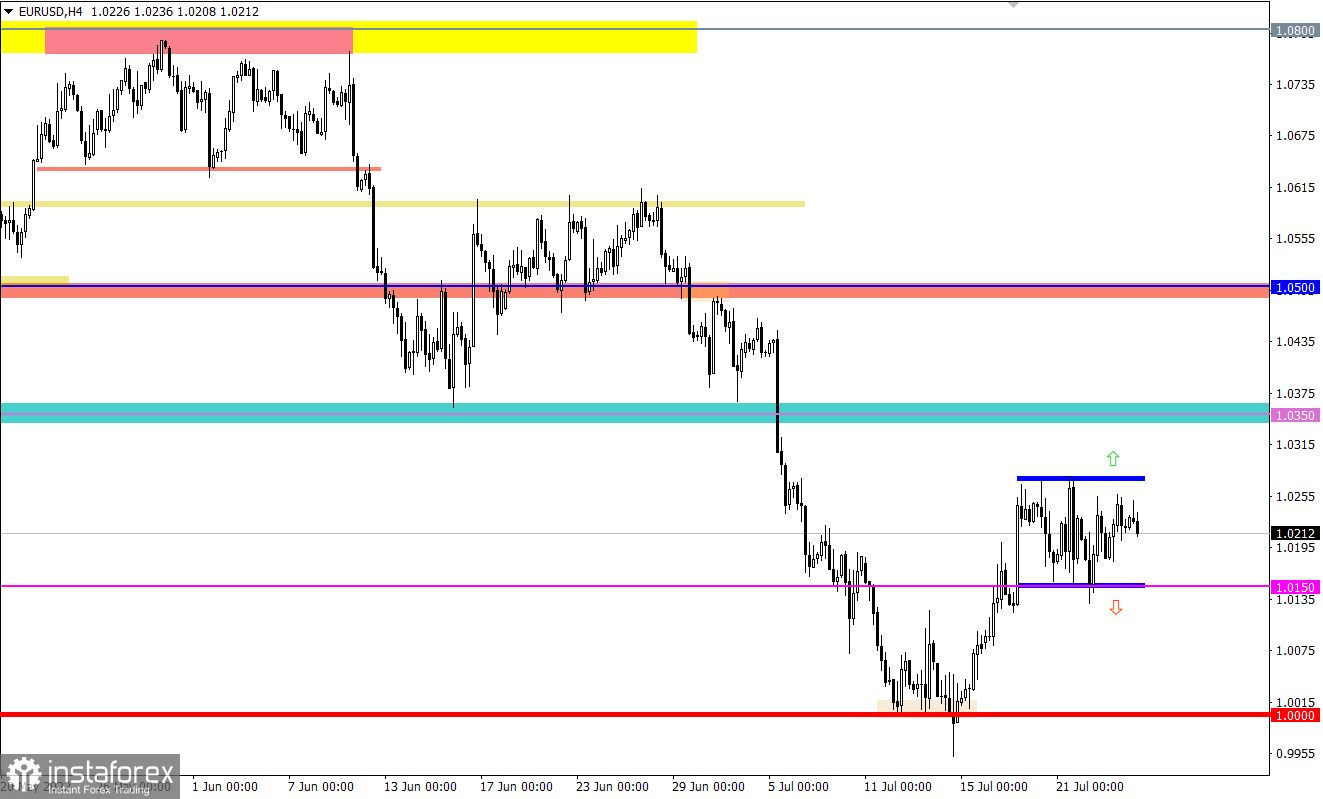
The EURUSD currency pair has been moving within the 1.0150/1.0270 side corridor for a week now, showing speculative activity from time to time. This kind of movement is characterized in the market as a process of accumulation of trading forces, where there is no clear direction in this period.
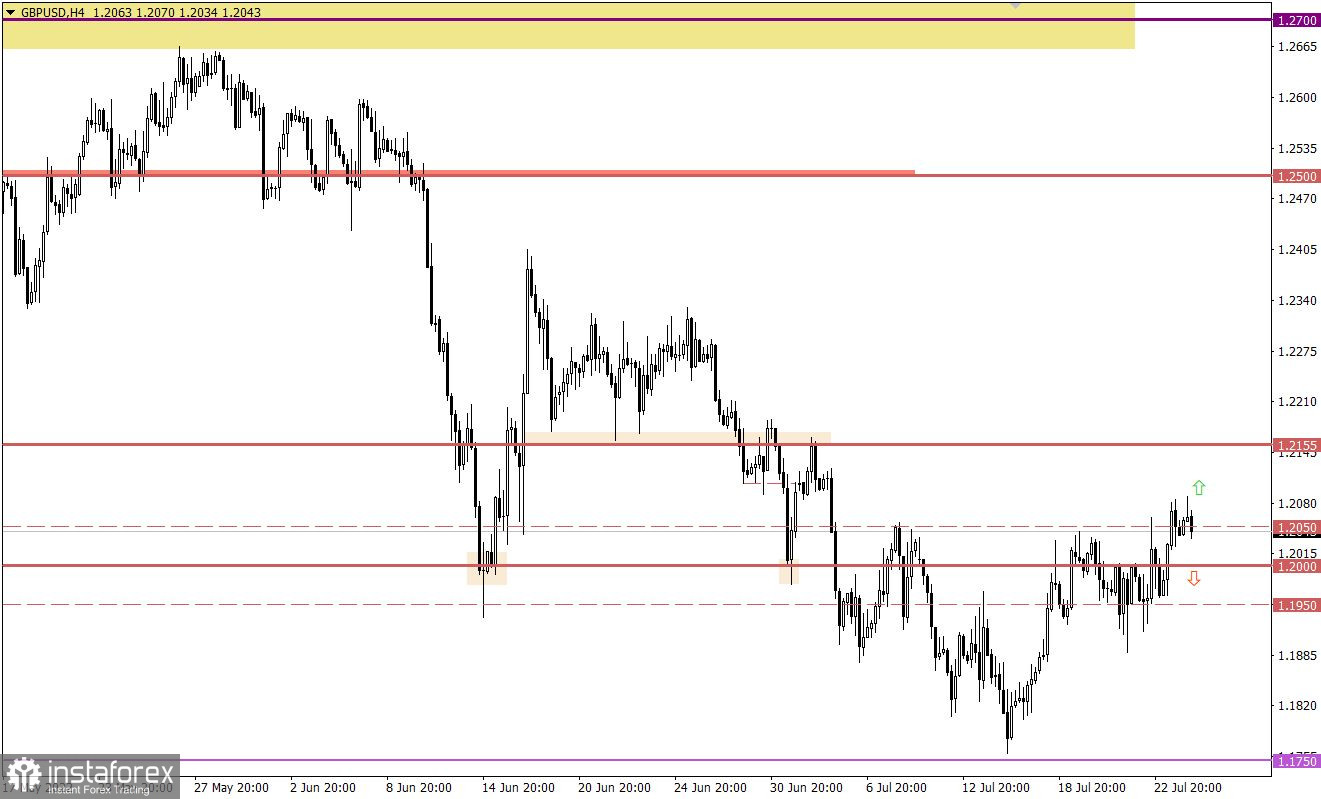
For the first time since the beginning of the month, the GBPUSD currency pair managed to stay above 1.2050. This step led to a prolonged correction from the local low of the downward trend at 1.1759.
Today, data on sales of new homes in the United States will be released. Probably, the market will ignore all the statistics, as today starts a two-day meeting of the Federal Open Market Committee, where, by the end of tomorrow, a decision on the interest rate will be made.
Time targeting
US S&P/Case-Shiller Home Price Index Composite-20 – 13:00 UTC
US New home sales – 14:00 UTC
In this situation, the trading tactics remain the same, the breakdown of one or another boundary of the established flat. As a result, an outgoing impulse will be received, which may indicate the subsequent price path.
In this regard, buy positions will be valid after the price holds above 1.0280 in a four-hour period, and sell positions will arise after the price holds below 1.0115 in a four-hour period.
As of now, there is a buy signal due to the price holding above the control value. In case of confirmation of expectations regarding the prolonged correction, the pound sterling may strengthen towards 1.2155.
The alternative scenario sees the current breakout as a bull trap. In this case, the return of the price below the 1.2000 level will lead to the cancellation of the previously received signal.
A candlestick chart view is graphical rectangles of white and black light, with sticks on top and bottom. When analyzing each candle in detail, you will see its characteristics of a relative period: the opening price, closing price, and maximum and minimum prices.
Horizontal levels are price coordinates, relative to which a stop or a price reversal may occur. These levels are called support and resistance in the market.
Circles and rectangles are highlighted examples where the price of the story unfolded. This color selection indicates horizontal lines that may put pressure on the quote in the future.
The up/down arrows are the reference points of the possible price direction in the future.
*La presente analisi del mercato ha un carattere esclusivamente informativo e non rappresenta una guida per l`effettuazione di una transazione.
Le recensioni analitiche di InstaSpot ti renderanno pienamente consapevole delle tendenze del mercato! Essendo un cliente InstaSpot, ti viene fornito un gran numero di servizi gratuiti per il trading efficiente.


