


La légende dans l'équipe InstaSpot!
La vraie légende! Vous pensez que c'est trop pathétique? Mais comment pouvez-vous appeler un homme qui, à 18 ans, est devenu le premier champion du monde d'échecs parmi les jeunes hommes d'Asie, et à dix-neuf ans – le premier grand maître de l'histoire de son pays? Ce fut le début de la voie du champion d'échecs –Viswanathan Anand – l'homme qui a inscrit son nom à jamais dans l'histoire des échecs du monde. Une autre légende dans l'équipe d'InstaSpot!


Le FC Borussia est l'un des clubs de football les plus titrés d'Allemagne, qui a prouvé à maintes reprises à ses fans que l'esprit de rivalité et de leadership mènera certainement au succès. Négociez de la même manière que les professionnels du sport mènent le jeu: en toute confiance et activement. Devenez un leader avec le FC Borussia et soyez en tête avec l'équipe InstaSpot!
Monday is traditionally accompanied by an empty macroeconomic calendar. Important statistics in Europe, the United Kingdom, and the United States are not expected.
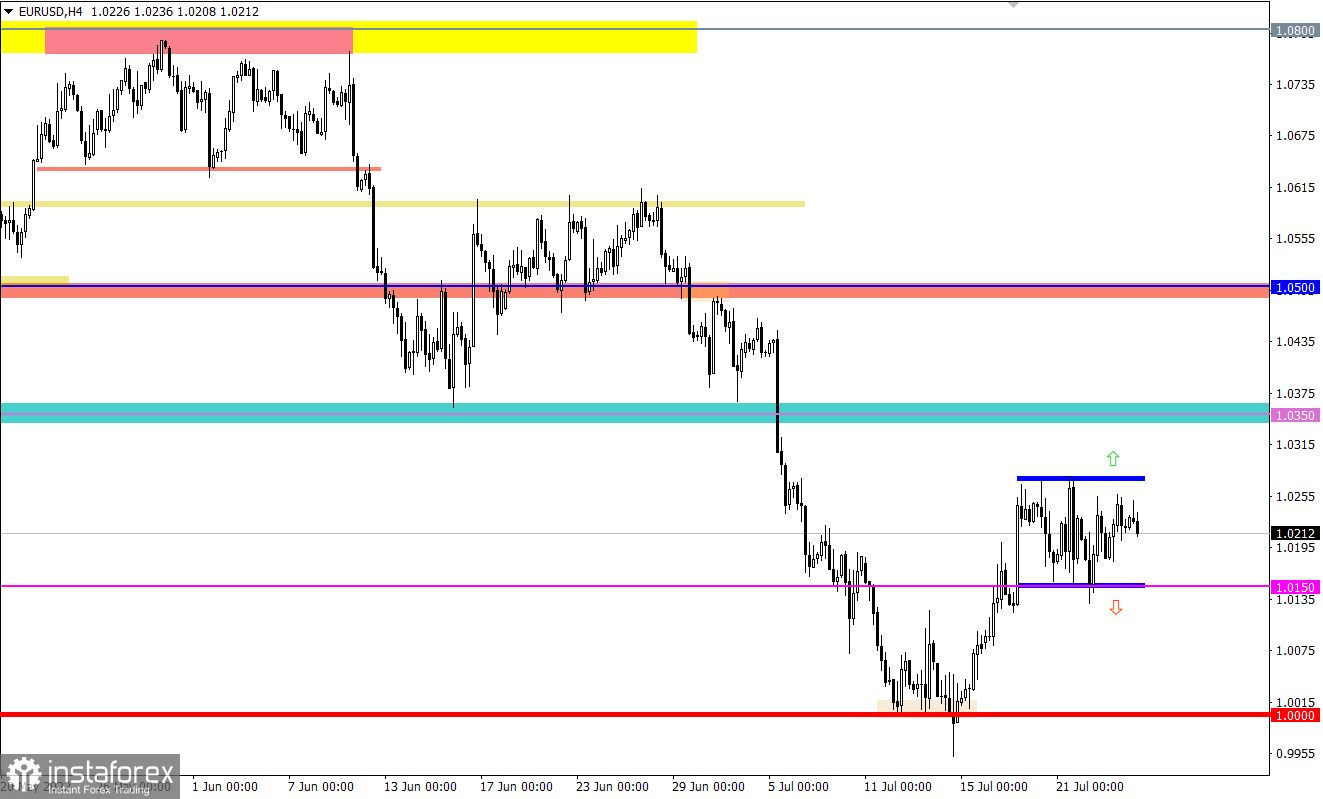
The EURUSD currency pair has been moving within the 1.0150/1.0270 side corridor for a week now, showing speculative activity from time to time. This kind of movement is characterized in the market as a process of accumulation of trading forces, where there is no clear direction in this period.
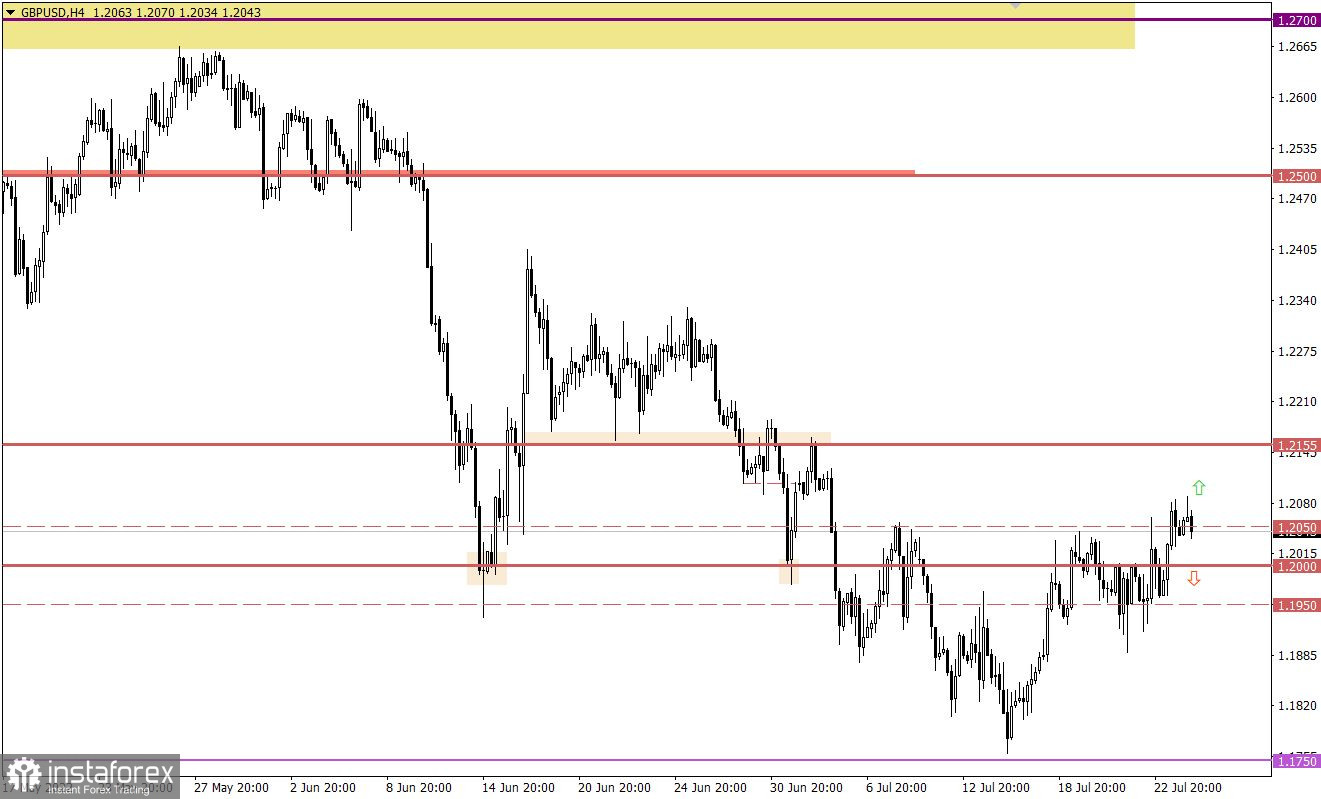
For the first time since the beginning of the month, the GBPUSD currency pair managed to stay above 1.2050. This step led to a prolonged correction from the local low of the downward trend at 1.1759.
Today, data on sales of new homes in the United States will be released. Probably, the market will ignore all the statistics, as today starts a two-day meeting of the Federal Open Market Committee, where, by the end of tomorrow, a decision on the interest rate will be made.
Time targeting
US S&P/Case-Shiller Home Price Index Composite-20 – 13:00 UTC
US New home sales – 14:00 UTC
In this situation, the trading tactics remain the same, the breakdown of one or another boundary of the established flat. As a result, an outgoing impulse will be received, which may indicate the subsequent price path.
In this regard, buy positions will be valid after the price holds above 1.0280 in a four-hour period, and sell positions will arise after the price holds below 1.0115 in a four-hour period.
As of now, there is a buy signal due to the price holding above the control value. In case of confirmation of expectations regarding the prolonged correction, the pound sterling may strengthen towards 1.2155.
The alternative scenario sees the current breakout as a bull trap. In this case, the return of the price below the 1.2000 level will lead to the cancellation of the previously received signal.
A candlestick chart view is graphical rectangles of white and black light, with sticks on top and bottom. When analyzing each candle in detail, you will see its characteristics of a relative period: the opening price, closing price, and maximum and minimum prices.
Horizontal levels are price coordinates, relative to which a stop or a price reversal may occur. These levels are called support and resistance in the market.
Circles and rectangles are highlighted examples where the price of the story unfolded. This color selection indicates horizontal lines that may put pressure on the quote in the future.
The up/down arrows are the reference points of the possible price direction in the future.
*The market analysis posted here is meant to increase your awareness, but not to give instructions to make a trade.
InstaSpot analytical reviews will make you fully aware of market trends! Being an InstaSpot client, you are provided with a large number of free services for efficient trading.


