


The legend in the InstaSpot team!
Legend! You think that's bombastic rhetoric? But how should we call a man, who became the first Asian to win the junior world chess championship at 18 and who became the first Indian Grandmaster at 19? That was the start of a hard path to the World Champion title for Viswanathan Anand, the man who became a part of history of chess forever. Now one more legend in the InstaSpot team!


Borussia is one of the most titled football clubs in Germany, which has repeatedly proved to fans: the spirit of competition and leadership will certainly lead to success. Trade in the same way that sports professionals play the game: confidently and actively. Keep a "pass" from Borussia FC and be in the lead with InstaSpot!
Monday is traditionally accompanied by an empty macroeconomic calendar. Important statistics in Europe, the United Kingdom, and the United States are not expected.
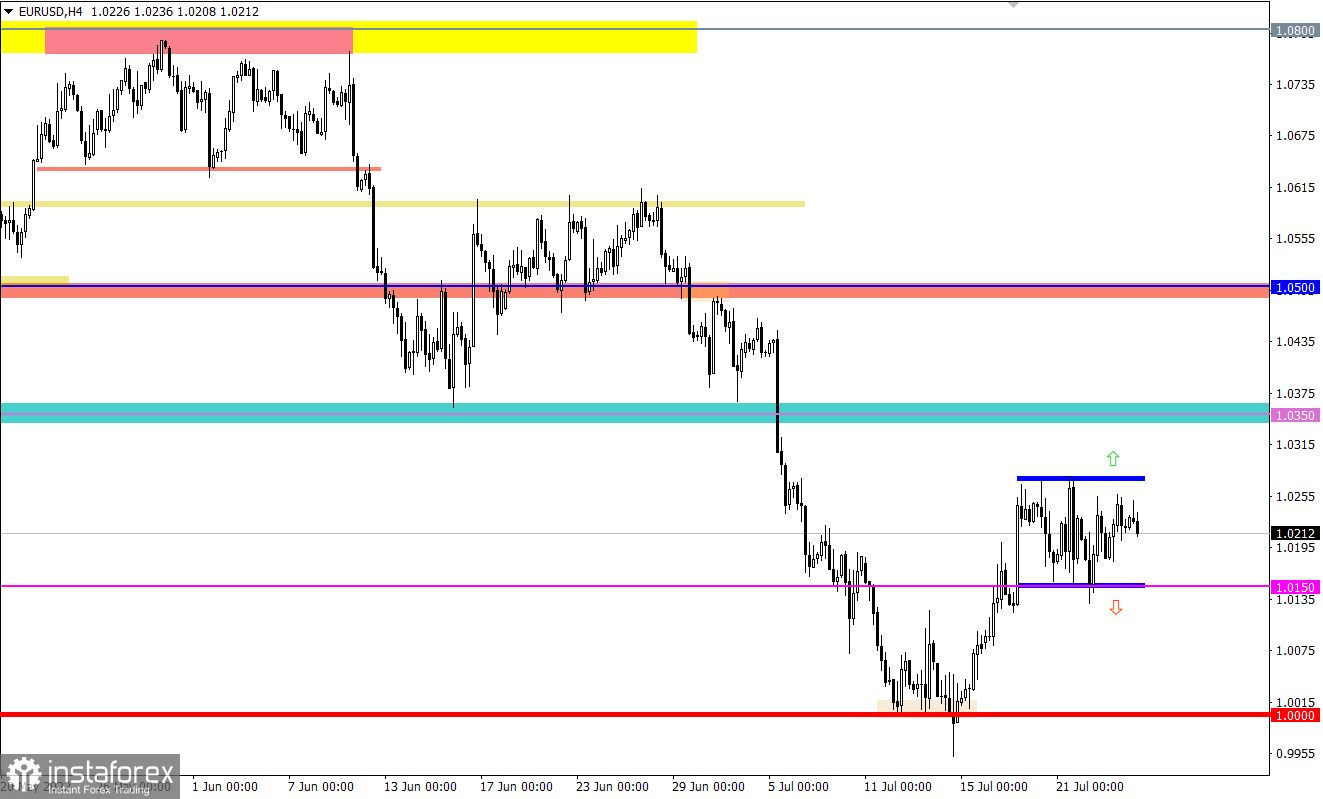
The EURUSD currency pair has been moving within the 1.0150/1.0270 side corridor for a week now, showing speculative activity from time to time. This kind of movement is characterized in the market as a process of accumulation of trading forces, where there is no clear direction in this period.
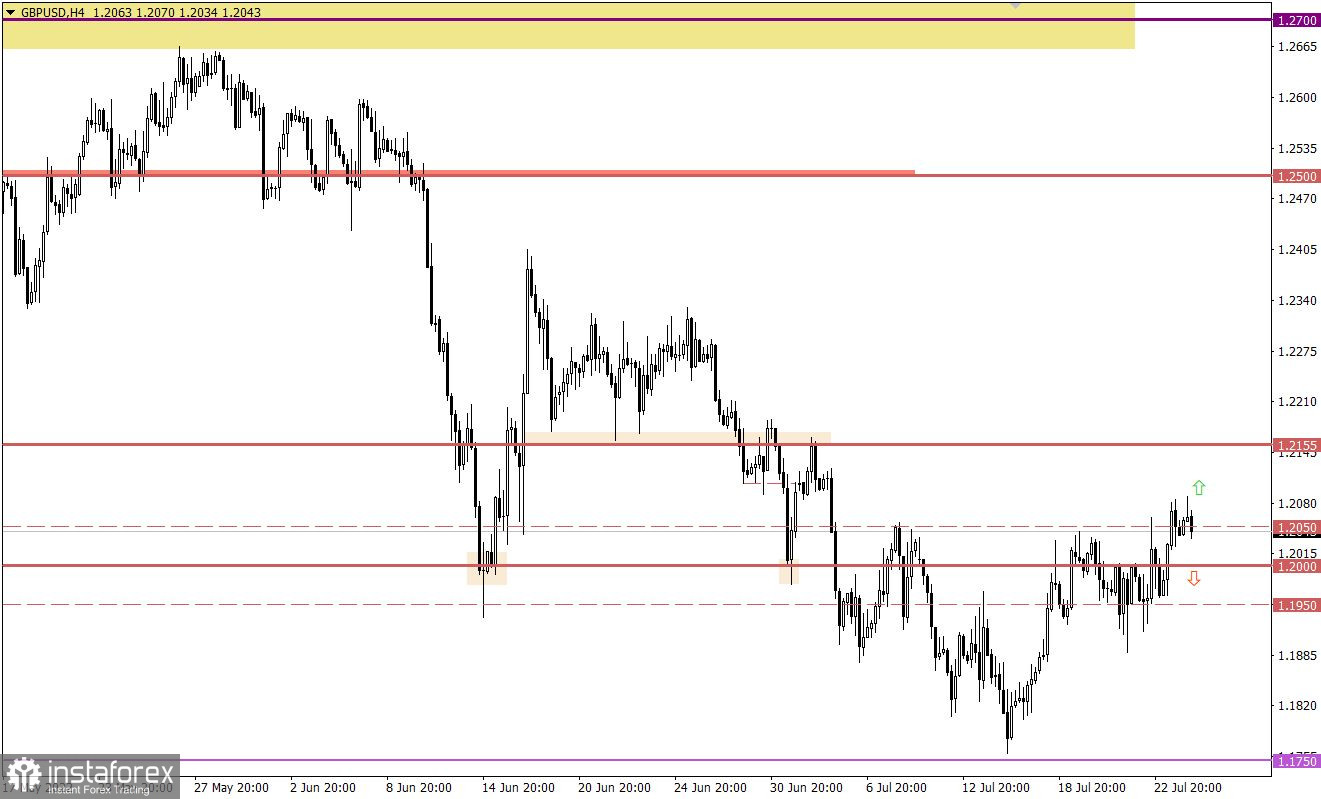
For the first time since the beginning of the month, the GBPUSD currency pair managed to stay above 1.2050. This step led to a prolonged correction from the local low of the downward trend at 1.1759.
Today, data on sales of new homes in the United States will be released. Probably, the market will ignore all the statistics, as today starts a two-day meeting of the Federal Open Market Committee, where, by the end of tomorrow, a decision on the interest rate will be made.
Time targeting
US S&P/Case-Shiller Home Price Index Composite-20 – 13:00 UTC
US New home sales – 14:00 UTC
In this situation, the trading tactics remain the same, the breakdown of one or another boundary of the established flat. As a result, an outgoing impulse will be received, which may indicate the subsequent price path.
In this regard, buy positions will be valid after the price holds above 1.0280 in a four-hour period, and sell positions will arise after the price holds below 1.0115 in a four-hour period.
As of now, there is a buy signal due to the price holding above the control value. In case of confirmation of expectations regarding the prolonged correction, the pound sterling may strengthen towards 1.2155.
The alternative scenario sees the current breakout as a bull trap. In this case, the return of the price below the 1.2000 level will lead to the cancellation of the previously received signal.
A candlestick chart view is graphical rectangles of white and black light, with sticks on top and bottom. When analyzing each candle in detail, you will see its characteristics of a relative period: the opening price, closing price, and maximum and minimum prices.
Horizontal levels are price coordinates, relative to which a stop or a price reversal may occur. These levels are called support and resistance in the market.
Circles and rectangles are highlighted examples where the price of the story unfolded. This color selection indicates horizontal lines that may put pressure on the quote in the future.
The up/down arrows are the reference points of the possible price direction in the future.
*这里的市场分析是为了增加您对市场的了解,而不是给出交易的指示。
InstaSpot分析评论将让您充分了解市场趋势! 作为InstaSpot的客户,您将获得大量的免费服务以实现有效的交易。


