


Nella nostra squadra ci sono più di 7.000.000 trader! Ogni giorno ci impegniamo a far sì che il trading migliori. Conseguiamo grandi risultati e ci muoviamo in avanti.
Il riconoscimento da parte di milioni di trader in tutto il mondo rappresenta l'alta valutazione della nostra attività! Voi avete fatto la vostra scelta e noi faremo la nostra al fine di soddisfare le vostre aspettative!
Assieme siamo una grande squadra!
InstaSpot. Siamo orgogliosi di lavorare per voi!


Attore, campione del mondo di lotta libera e semplicemente un vero maciste russo! Persona venuta dal nulla. Persona che rispecchia i nostri obiettivi. Il segreto del successo di Taktarov consiste nel mirare continuamente al suo scopo.
Dischiudi anche tu tutti gli aspetti del tuo talento! Impara, prova, sbaglia, ma non fermarti!
InstaSpot - la storia delle tue vittorie inizia qui!

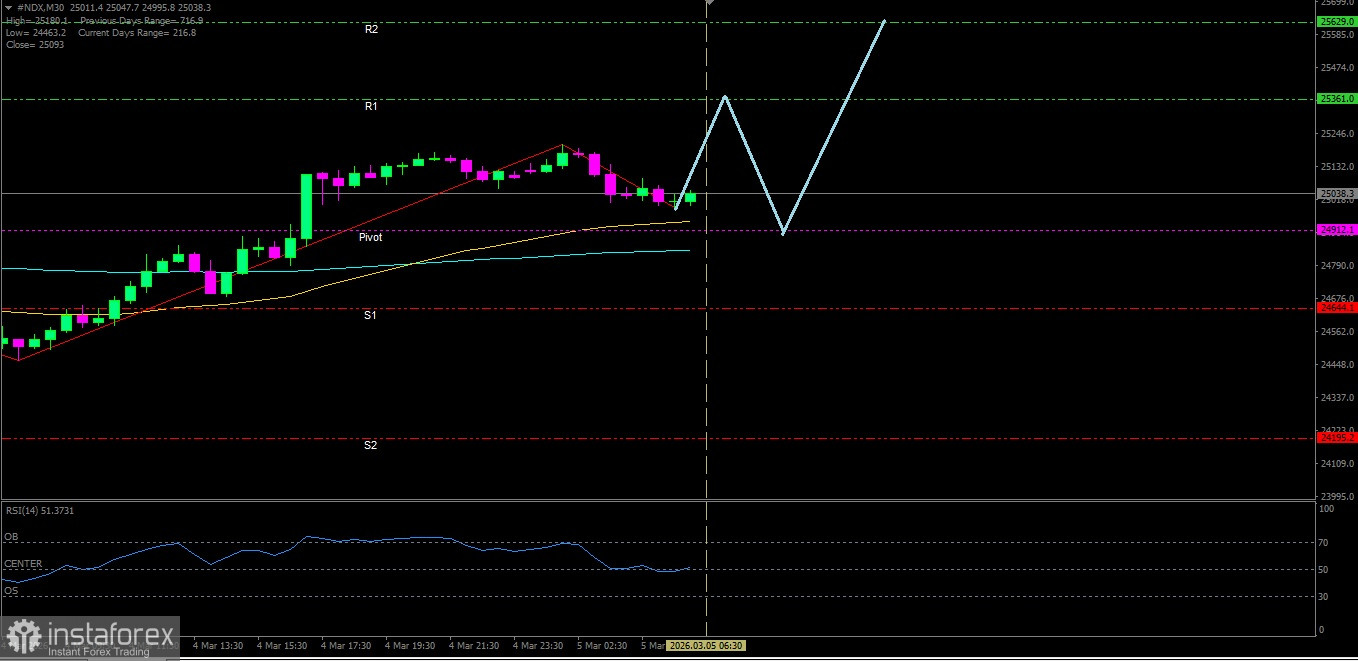
[#NDX]
Although RSI(14) indicator is in the Neutral-Bearish area, but with both EMAs forming a Golden Cross gives the confirmation that the Nasdaq 100 index still has the potential to continue its strengthening.
Key Levels
1. Resistance. 2 : 25629.0
2. Resistance. 1 : 25361.0
3. Pivot : 24912.1
4. Support. 1 : 24644.1
5. Support. 2 : 24195.2
Tactical Scenario
Positive Reaction Zone: If the price breaks out above 25361.0, there is a likelihood of a move up toward 25629.0.
Momentum Extension Bias: If 25629.0 is broken, the Nasdaq 100 could attempt to test 26077.9.
Invalidation Level / Bias Revision
The upside bias weakens if #NDX falls below 24195.2.
Technical Summary
EMA(50) : 24939.0
EMA(200): 24841.5
RSI(14) : 48.34
Economic News Release Agenda:
Tonight the United States will release the following economic data:
US - Challenger Job Cuts y/y - 19:30 WIB
US - Unemployment Claims - 20:30 WIB
US - Import Prices m/m - 20:30 WIB
US - Prelim Nonfarm Productivity q/q - 20:30 WIB
US - Prelim Unit Labor Costs q/q - 20:30 WIB
US - Natural Gas Storage - 22:30 WIB
*La presente analisi del mercato ha un carattere esclusivamente informativo e non rappresenta una guida per l`effettuazione di una transazione.
Le recensioni analitiche di InstaSpot ti renderanno pienamente consapevole delle tendenze del mercato! Essendo un cliente InstaSpot, ti viene fornito un gran numero di servizi gratuiti per il trading efficiente.


