


A lenda da equipe InstaSpot!
Lenda! Você acha que isso é retórica bombástica? Mas como devemos chamar um homem que se tornou o primeiro asiático a vencer o campeonato mundial de xadrez aos 18 anos e que se tornou o primeiro grande mestre indiano aos 19? Esse foi o começo de um caminho difícil para o título de campeão do mundo para Viswanathan Anand, o homem que se tornou parte da história do xadrez para sempre. Agora mais uma lenda na equipe InstaSpot!


O Borussia é um dos clubes de futebol com mais títulos da Alemanha, que provou repetidamente aos fãs: o espírito de competição e liderança certamente levará ao sucesso. Negocie da mesma maneira que os profissionais do esporte jogam: com confiança e ativamente. Mantenha o "ritmo" do Borussia FC e esteja na liderança com a InstaSpot!
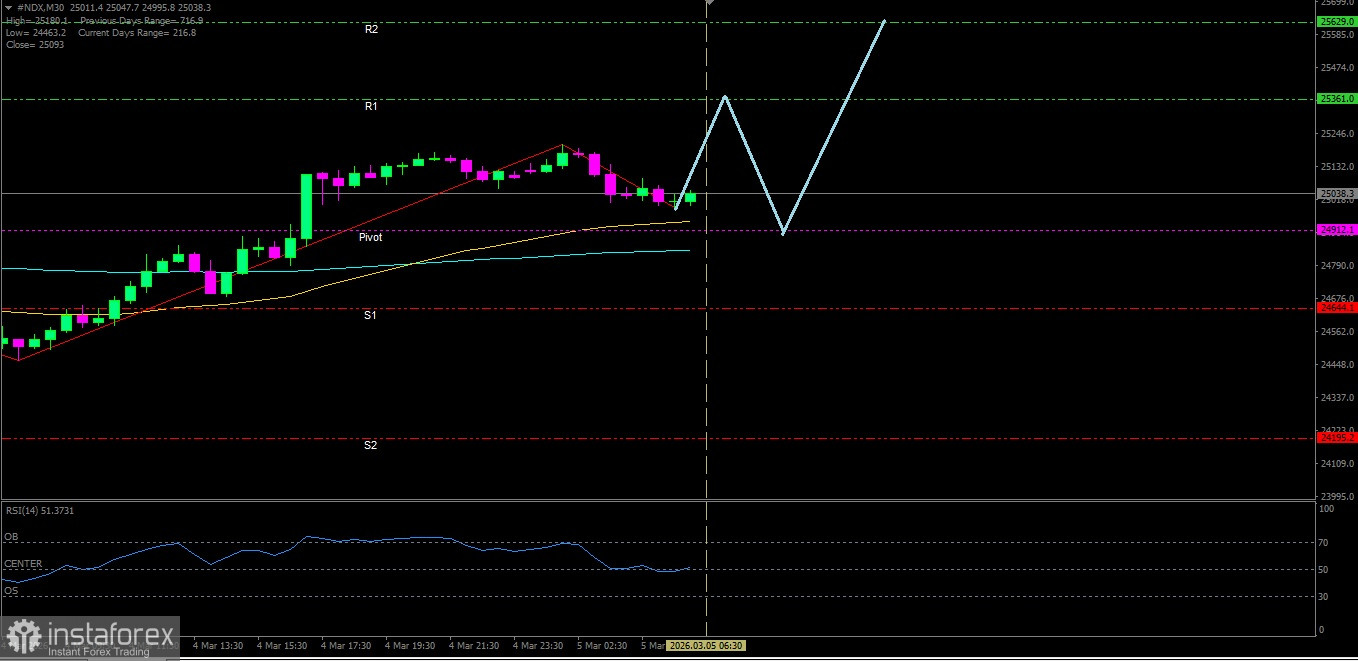
[#NDX]
Although RSI(14) indicator is in the Neutral-Bearish area, but with both EMAs forming a Golden Cross gives the confirmation that the Nasdaq 100 index still has the potential to continue its strengthening.
Key Levels
1. Resistance. 2 : 25629.0
2. Resistance. 1 : 25361.0
3. Pivot : 24912.1
4. Support. 1 : 24644.1
5. Support. 2 : 24195.2
Tactical Scenario
Positive Reaction Zone: If the price breaks out above 25361.0, there is a likelihood of a move up toward 25629.0.
Momentum Extension Bias: If 25629.0 is broken, the Nasdaq 100 could attempt to test 26077.9.
Invalidation Level / Bias Revision
The upside bias weakens if #NDX falls below 24195.2.
Technical Summary
EMA(50) : 24939.0
EMA(200): 24841.5
RSI(14) : 48.34
Economic News Release Agenda:
Tonight the United States will release the following economic data:
US - Challenger Job Cuts y/y - 19:30 WIB
US - Unemployment Claims - 20:30 WIB
US - Import Prices m/m - 20:30 WIB
US - Prelim Nonfarm Productivity q/q - 20:30 WIB
US - Prelim Unit Labor Costs q/q - 20:30 WIB
US - Natural Gas Storage - 22:30 WIB
*A análise de mercado aqui postada destina-se a aumentar o seu conhecimento, mas não dar instruções para fazer uma negociação.
InstaSpot analytical reviews will make you fully aware of market trends! Being an InstaSpot client, you are provided with a large number of free services for efficient trading.


