


The legend in the InstaSpot team!
Legend! You think that's bombastic rhetoric? But how should we call a man, who became the first Asian to win the junior world chess championship at 18 and who became the first Indian Grandmaster at 19? That was the start of a hard path to the World Champion title for Viswanathan Anand, the man who became a part of history of chess forever. Now one more legend in the InstaSpot team!


Borussia is one of the most titled football clubs in Germany, which has repeatedly proved to fans: the spirit of competition and leadership will certainly lead to success. Trade in the same way that sports professionals play the game: confidently and actively. Keep a "pass" from Borussia FC and be in the lead with InstaSpot!

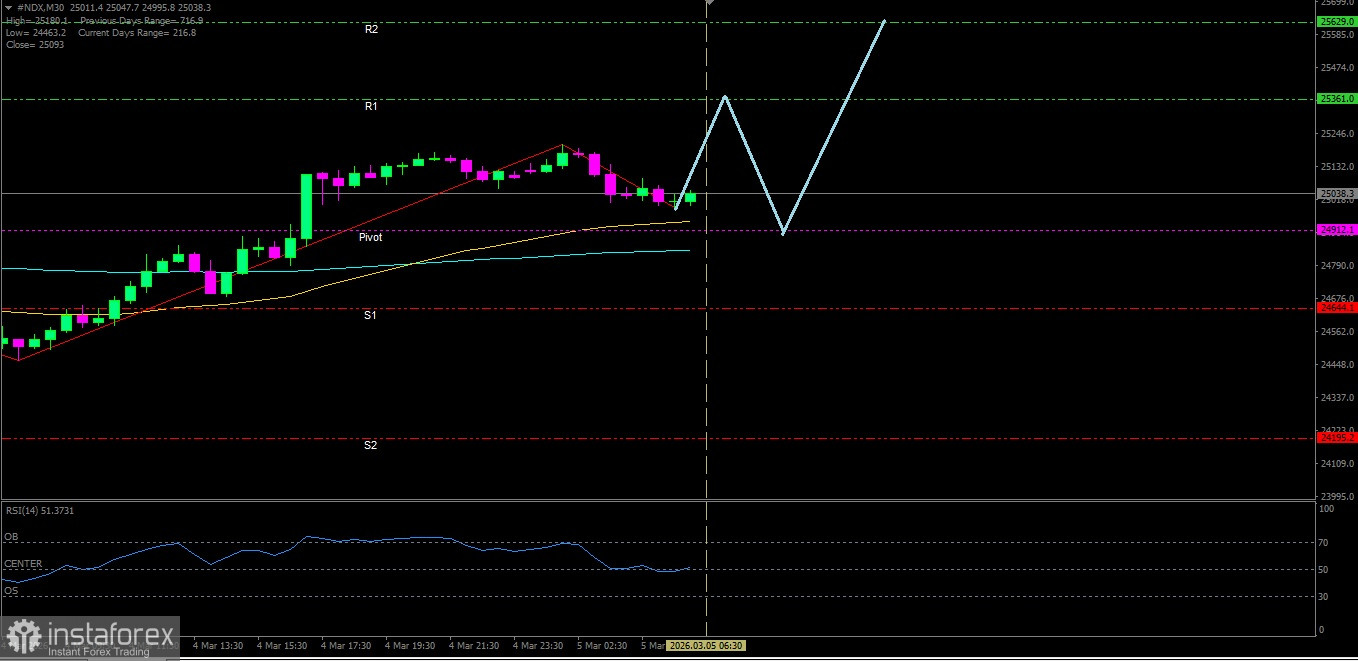
[#NDX]
Although RSI(14) indicator is in the Neutral-Bearish area, but with both EMAs forming a Golden Cross gives the confirmation that the Nasdaq 100 index still has the potential to continue its strengthening.
Key Levels
1. Resistance. 2 : 25629.0
2. Resistance. 1 : 25361.0
3. Pivot : 24912.1
4. Support. 1 : 24644.1
5. Support. 2 : 24195.2
Tactical Scenario
Positive Reaction Zone: If the price breaks out above 25361.0, there is a likelihood of a move up toward 25629.0.
Momentum Extension Bias: If 25629.0 is broken, the Nasdaq 100 could attempt to test 26077.9.
Invalidation Level / Bias Revision
The upside bias weakens if #NDX falls below 24195.2.
Technical Summary
EMA(50) : 24939.0
EMA(200): 24841.5
RSI(14) : 48.34
Economic News Release Agenda:
Tonight the United States will release the following economic data:
US - Challenger Job Cuts y/y - 19:30 WIB
US - Unemployment Claims - 20:30 WIB
US - Import Prices m/m - 20:30 WIB
US - Prelim Nonfarm Productivity q/q - 20:30 WIB
US - Prelim Unit Labor Costs q/q - 20:30 WIB
US - Natural Gas Storage - 22:30 WIB
*এখানে পোস্ট করা মার্কেট বিশ্লেষণ আপনার সচেতনতা বৃদ্ধির জন্য প্রদান করা হয়, ট্রেড করার নির্দেশনা প্রদানের জন্য প্রদান করা হয় না।
ইন্সটাফরেক্স বিশ্লেষণমূলক পর্যালোচনাগুলো আপনাকে মার্কেট প্রবণতা সম্পর্কে পুরোপুরি সচেতন করবে! ইন্সটাফরেক্সের একজন গ্রাহক হওয়ায়, দক্ষ ট্রেডিং এর জন্য আপনাকে অনেক সেবা বিনামূল্যে প্রদান করা হয়।


