


Il y a maintenant plus de 7 millions de traders dans notre équipe! Chaque jour nous travaillons à améliorer le trading. On s'efforce de vous offrir le meilleur et on obtient les plus beaux succès.
La confiance de millions de traders partout dans le monde est l'évaluation la plus élevée de notre travail!
Vous avez fait votre choix et nous allons faire de notre mieux pour répondre à vos attentes!
Ensemble, nous faisons une super équipe!
InstaSpot est fier de vous servir!


L'acteur, le champion de l'UFC et un vrai bogatyr russe! . Homme qui ne doit sa réussite qu'à lui-même. L'homme qui est sur la même route que nous suivons.
Le secret du succès de Taktarov est le progrès permanent vers la réalisation de son objectif.
Découvrez toutes les facettes de votre talent! Apprenez, essayez, commettez des erreurs, mais ne vous arrêtez pas!
InstaSpot - L'histoire de votre succès commence ici !
Trend analysis (Fig. 1).
The GBP/USD currency pair may move downward from the level of 1.2744 (closing of yesterday's daily candle) to test the 1.2713 support level (blue thick line). Upon reaching this level, an upward movement is possible to test 1.2797, the historical support level (blue dotted line).
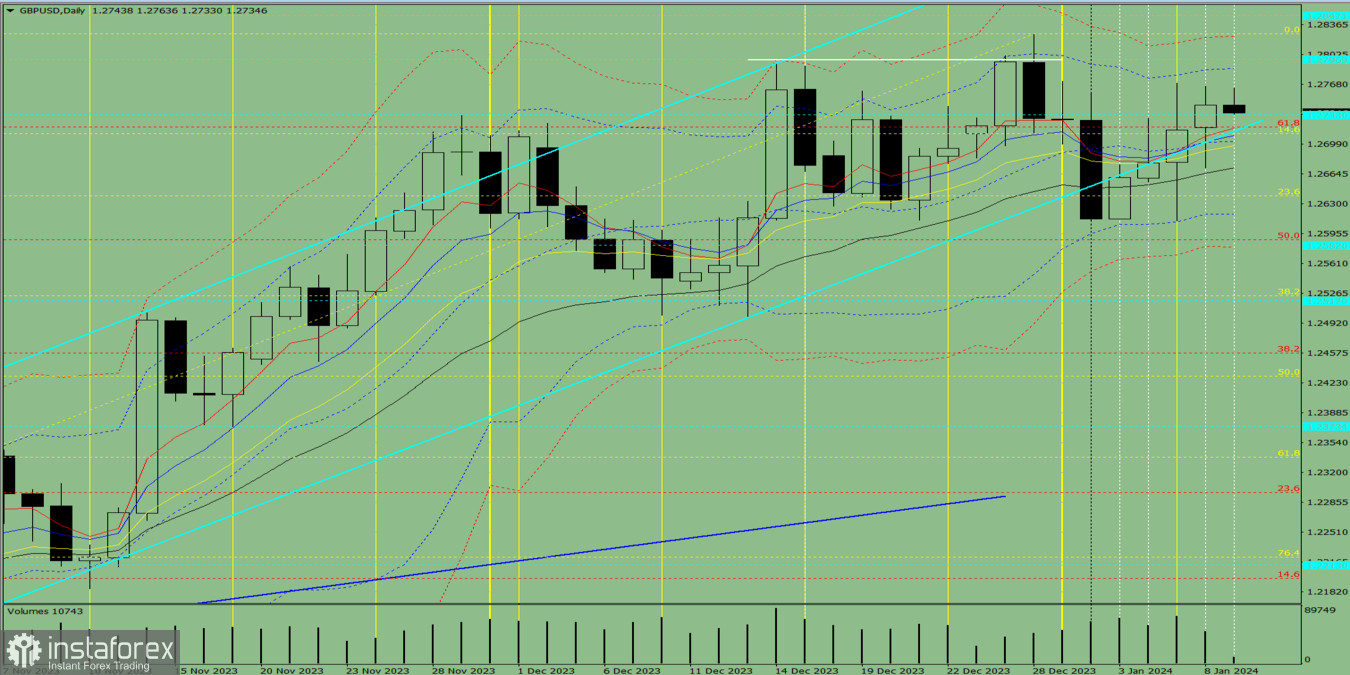
Fig. 1 (daily chart).
Comprehensive analysis:
General conclusion: Today, the price may move downward from the level of 1.2744 (closing of yesterday's daily candle) to test the 1.2713 support level (blue thick line). Upon reaching this level, an upward movement is possible to test 1.2797, the historical support level (blue dotted line).
Alternatively, the price may move downward from the level of 1.2744 (closing of yesterday's daily candle) to test 1.2672, the 21-period EMA (thin black line). Upon reaching this level, an upward movement is possible to test 1.2797, the historical support level (blue dotted line).
*The market analysis posted here is meant to increase your awareness, but not to give instructions to make a trade.
InstaSpot analytical reviews will make you fully aware of market trends! Being an InstaSpot client, you are provided with a large number of free services for efficient trading.


