


我们的团队有超过700万的操盘手!
我们每天都在一起努力改善交易。我们得到了很高的成绩,并继续前进。
世界各地数以百万计的操盘手的认可是我们工作的最大赞赏! 您做出了您的选择,我们将尽一切努力来满足您的期望!
我们是一个共同的伟大团队!
InstaSpot. 自豪地为您工作!


Trend analysis (Fig. 1).
The GBP/USD currency pair may move downward from the level of 1.2744 (closing of yesterday's daily candle) to test the 1.2713 support level (blue thick line). Upon reaching this level, an upward movement is possible to test 1.2797, the historical support level (blue dotted line).
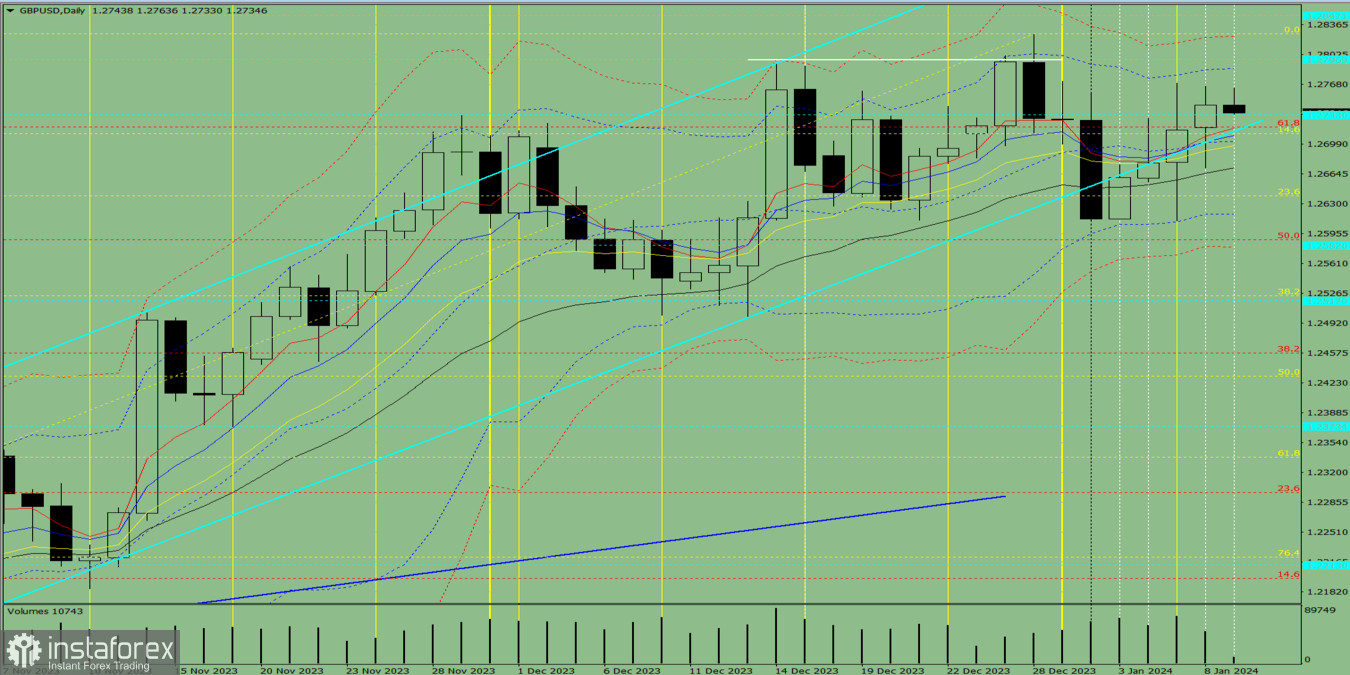
Fig. 1 (daily chart).
Comprehensive analysis:
General conclusion: Today, the price may move downward from the level of 1.2744 (closing of yesterday's daily candle) to test the 1.2713 support level (blue thick line). Upon reaching this level, an upward movement is possible to test 1.2797, the historical support level (blue dotted line).
Alternatively, the price may move downward from the level of 1.2744 (closing of yesterday's daily candle) to test 1.2672, the 21-period EMA (thin black line). Upon reaching this level, an upward movement is possible to test 1.2797, the historical support level (blue dotted line).
*这里的市场分析是为了增加您对市场的了解,而不是给出交易的指示。
InstaSpot分析评论将让您充分了解市场趋势! 作为InstaSpot的客户,您将获得大量的免费服务以实现有效的交易。


