


Нашият екип има над 7 000 000 търговци!
Всеки ден работим заедно, за да подобрим търговията. Получаваме високи резултати и напредваме.
Признанието от милионите търговци по целия свят е най-доброто признание за нашата работа! Направихте своя избор и ние ще направим всичко, което е необходимо, за да отговорим на вашите очаквания!
Ние сме един страхотен екип заедно!
ИнстаФорекс. Горд съм да работя за вас!


Актьор, шампион на UFC 6 турнира и истински герой!
Човекът, който изгради себе си. Човекът, който върви по пътя ни.
Тайната зад успеха на Тактаров е постоянно движение към целта.
Открийте всички страни на вашия талант!
Откривайте, опитвайте, проваляйте се - но никога не спирайте!
ИнстаФорекс. Вашата успешна история започва тук!

Trend analysis (Fig. 1).
The GBP/USD currency pair may move downward from the level of 1.2744 (closing of yesterday's daily candle) to test the 1.2713 support level (blue thick line). Upon reaching this level, an upward movement is possible to test 1.2797, the historical support level (blue dotted line).
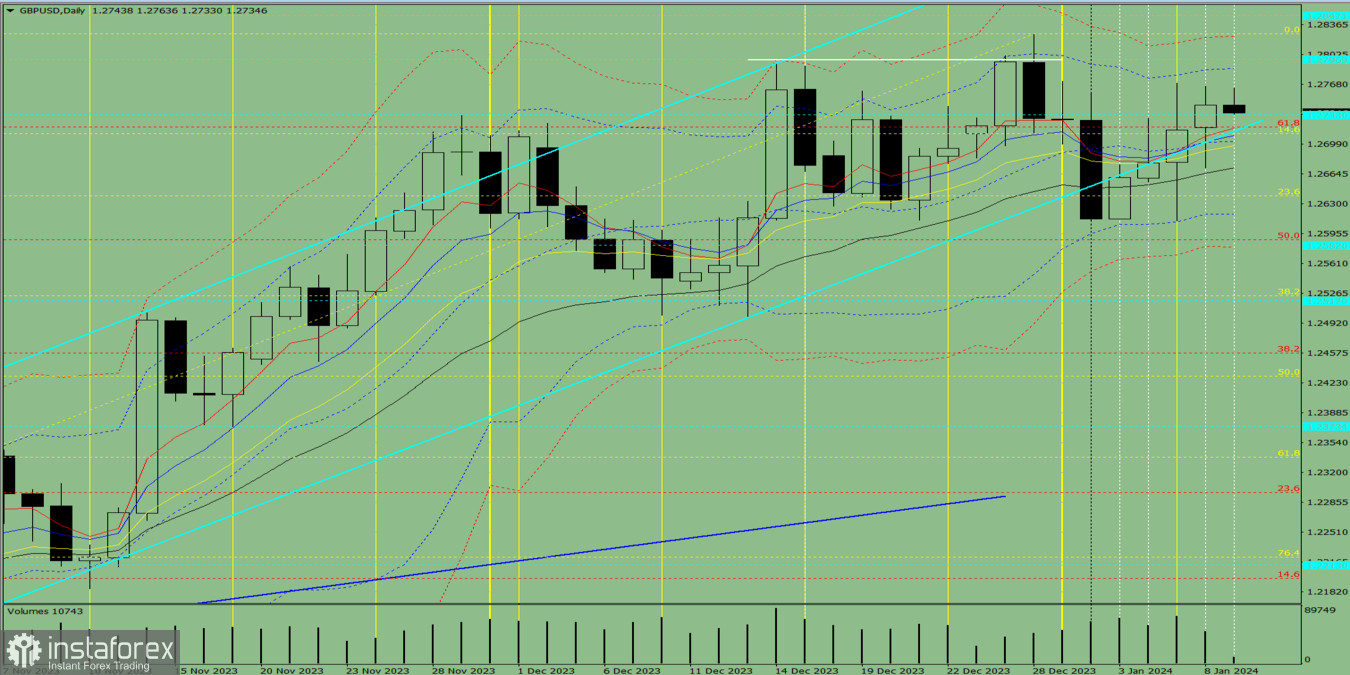
Fig. 1 (daily chart).
Comprehensive analysis:
General conclusion: Today, the price may move downward from the level of 1.2744 (closing of yesterday's daily candle) to test the 1.2713 support level (blue thick line). Upon reaching this level, an upward movement is possible to test 1.2797, the historical support level (blue dotted line).
Alternatively, the price may move downward from the level of 1.2744 (closing of yesterday's daily candle) to test 1.2672, the 21-period EMA (thin black line). Upon reaching this level, an upward movement is possible to test 1.2797, the historical support level (blue dotted line).
*Анализът на пазара публикуван тук има за цел да повиши информираността Ви, но не и да дава указания за търговия.
Аналитичните прегледи на ИнстаФорекс ще ви запознаят изцяло с пазарните тенденции! Като клиент на ИнстаФорекс, на вас се предоставят голям брой безплатни услуги за ефикасна търговия.


