


Il y a maintenant plus de 7 millions de traders dans notre équipe! Chaque jour nous travaillons à améliorer le trading. On s'efforce de vous offrir le meilleur et on obtient les plus beaux succès.
La confiance de millions de traders partout dans le monde est l'évaluation la plus élevée de notre travail!
Vous avez fait votre choix et nous allons faire de notre mieux pour répondre à vos attentes!
Ensemble, nous faisons une super équipe!
InstaSpot est fier de vous servir!


L'acteur, le champion de l'UFC et un vrai bogatyr russe! . Homme qui ne doit sa réussite qu'à lui-même. L'homme qui est sur la même route que nous suivons.
Le secret du succès de Taktarov est le progrès permanent vers la réalisation de son objectif.
Découvrez toutes les facettes de votre talent! Apprenez, essayez, commettez des erreurs, mais ne vous arrêtez pas!
InstaSpot - L'histoire de votre succès commence ici !
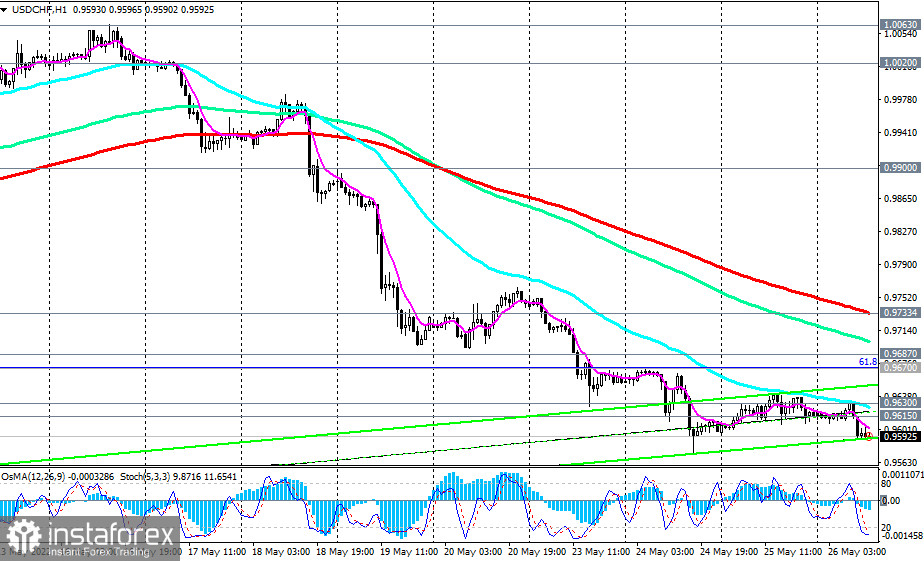
USD/CHF is trading near 0.9592 as of this writing, down from a nearly 2-week high at 1.0020.
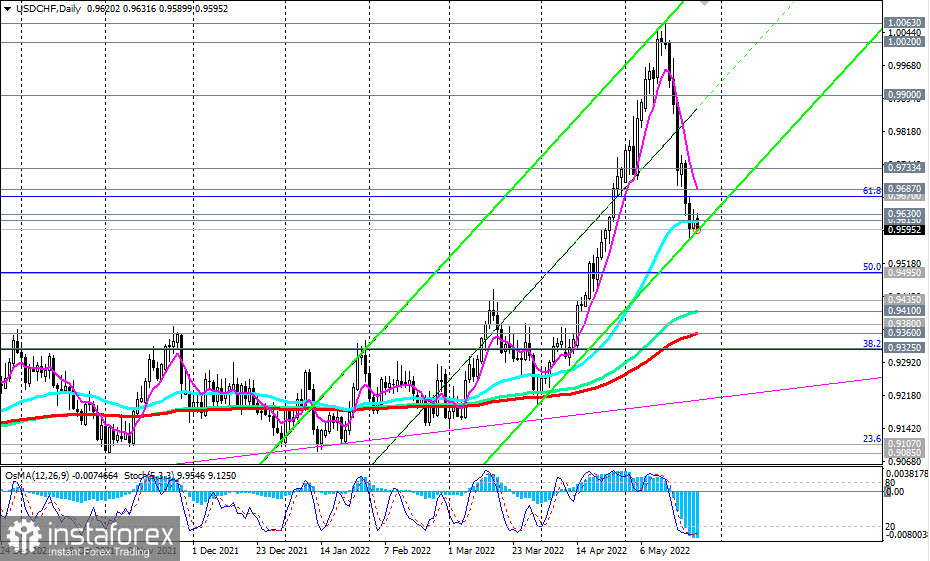
Despite the decline, the long-term upward trend of USD/CHF remains, while the pair reached important support levels at 0.9615 (50 EMA on the daily chart), and 0.9595 (the lower limit of the ascending channel on the daily chart), from which a rebound and resumption of growth is possible.
A strong upward impulse prevails, which is provided primarily by the prospects for further strengthening of the dollar against the backdrop of the Fed's monetary policy, the most aggressive in comparison with the policies of other major world central banks.
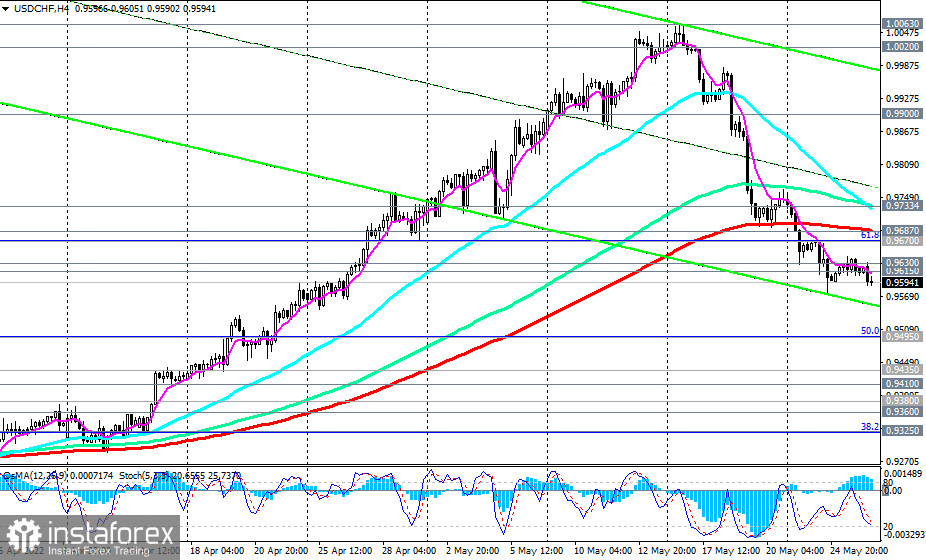
If, as we assumed, there is a rebound from the current support levels, then the first ("fast") signal for entering long positions will be a breakdown of the local resistance levels at 0.9630, 0.9642, and the confirming one will be a breakdown of the resistance levels at 0.9687 (200 EMA on the 4-hour chart), and 0.9733 (200 EMA on the 1-hour chart).
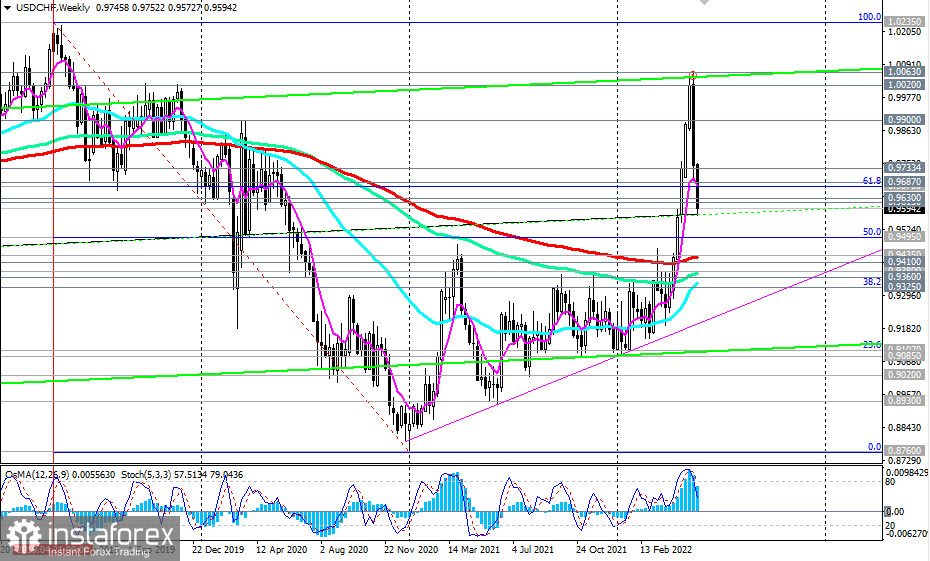
In an alternative scenario, and if the fundamental background still pushes the USD/CHF quotes lower, the downward correction may continue up to the support levels 0.9435 (200 EMA on the weekly chart), and 0.9410 (144 EMA on the daily chart).
A breakdown of support levels 0.9360 (200 EMA on the daily chart), and 0.9325 (38.2% Fibonacci retracement of the upward correction to the downward wave that began in April 2019 near 1.0235) may once again push USD/CHF into the bear market zone.
It should be noted that today's publication (at 12:30 GMT) of the report of the US Bureau of Economic Analysis with data on the country's GDP can become a new driver of movement.
Support levels: 0.9615, 0.9595, 0.9500, 0.9495, 0.9435, 0.9410, 0.9380, 0.9360, 0.9325, 0.9300
Resistance levels: 0.9630, 0.9642, 0.9670, 0.9687, 0.9733, 0.9900, 1.0000, 1.0020, 1.0063
Trading tips
Sell Stop – 0.9565. Stop-Loss – 0.9655. Take-Profit –0.9500, 0.9495, 0.9435, 0.9410, 0.9380, 0.9360, 0.9325, 0.9300
Buy Stop – 0.9655. Stop-Loss – 0.9565. Take-Profit – 0.9670, 0.9687, 0.9733, 0.9900, 1.0000, 1.0020, 1.0063
*The market analysis posted here is meant to increase your awareness, but not to give instructions to make a trade.
InstaSpot analytical reviews will make you fully aware of market trends! Being an InstaSpot client, you are provided with a large number of free services for efficient trading.


