


ทีมงานของพวกเรา พร้อมกับเทรดเดอร์มากกว่า 7,000,000 คน!
ในทุกวัน พวกเราได้รวมงานร่วมกันเพื่อพัฒนาการเทรด พวกเรามีผลตอบรับที่ดี และยังเดินหน้าต่อไป
การยอมรับจากเทรดเดอร์นับล้านจากทั่วทุกมุมโลกนั้นเป็น ผลงา่นอันน่าประทับใจมากที่สุดของพวกเรา! คุณเลือกตัวเลือก และพวกเราจะจัดการทุกอย่างให้ตรงกับการคาดหวังของคุณ !
พวกเราเป็นทีมงานที่ดีที่สุด!
InstaSpot รู้สึกเป็นเกียรติที่ได้ร่วมงานกับคุณ !


นักแสดง, แชมป์เปี้ยนทัวร์นาเม้น UFC 6 และฮิโรที่แท้จริง !
ชายผู้สามารถก่อร่างสร้างตัวขึ้นมาได้ด้วยตัวเขาเอง ชายผู้ที่นำพาเส้นทางให้พวกเรา
ความลับที่อยู่เบื้องหลังความสำเร็จของ Taktarov ก็คือการมุ่งหน้าไปสู่เป้าหมายแบบทันที
เปิดเผยทุกด้านของความสำเร็จคุณ !
ค้นพบ, พยายาม, ผิดพลาดได้ แต่อย่าพึ่งหยุดยั่ง !
InstaSpot ที่พร้อมจะเป็นจุดเริ่มต้น เรื่องราวความสำเร็จของคุณ !

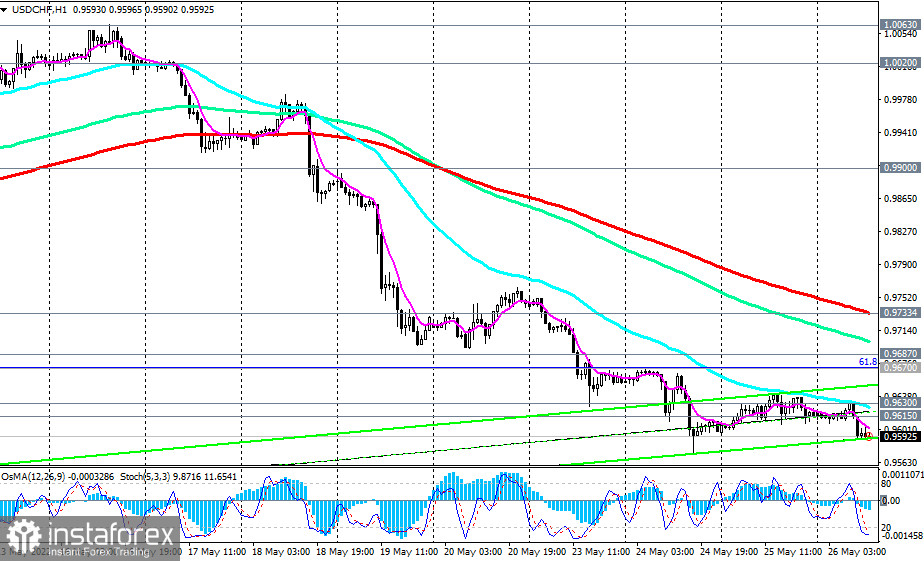
USD/CHF is trading near 0.9592 as of this writing, down from a nearly 2-week high at 1.0020.
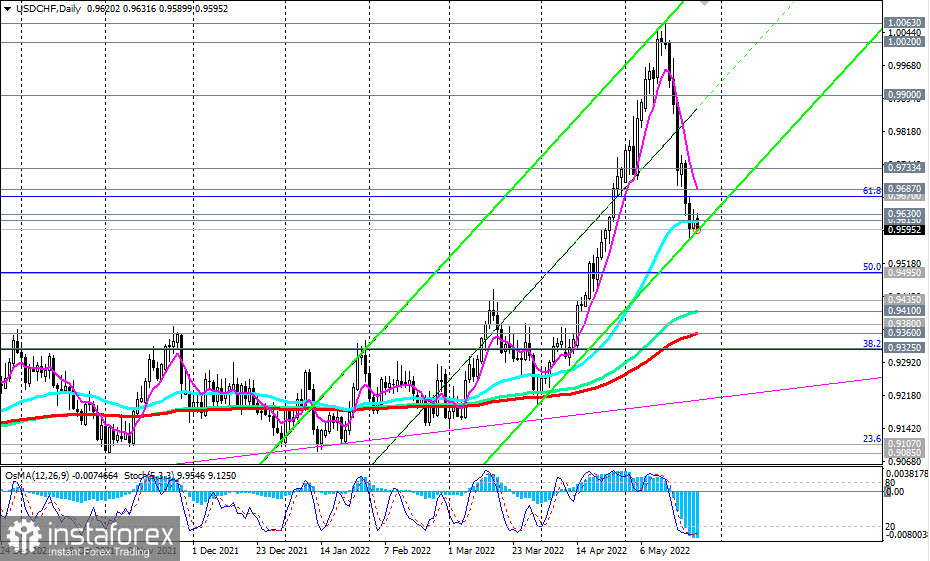
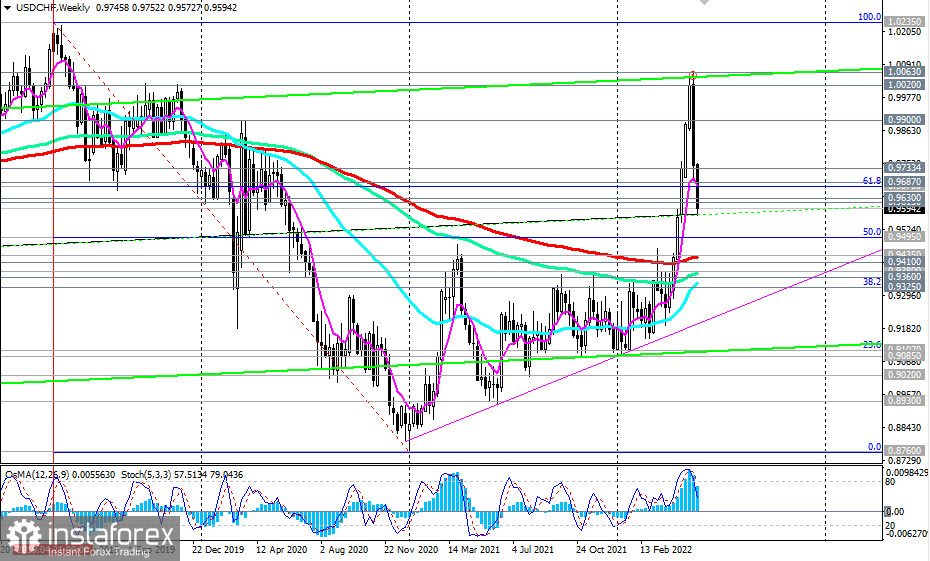
Despite the decline, the long-term upward trend of USD/CHF remains, while the pair reached important support levels at 0.9615 (50 EMA on the daily chart), and 0.9595 (the lower limit of the ascending channel on the daily chart), from which a rebound and resumption of growth is possible.
A strong upward impulse prevails, which is provided primarily by the prospects for further strengthening of the dollar against the backdrop of the Fed's monetary policy, the most aggressive in comparison with the policies of other major world central banks.
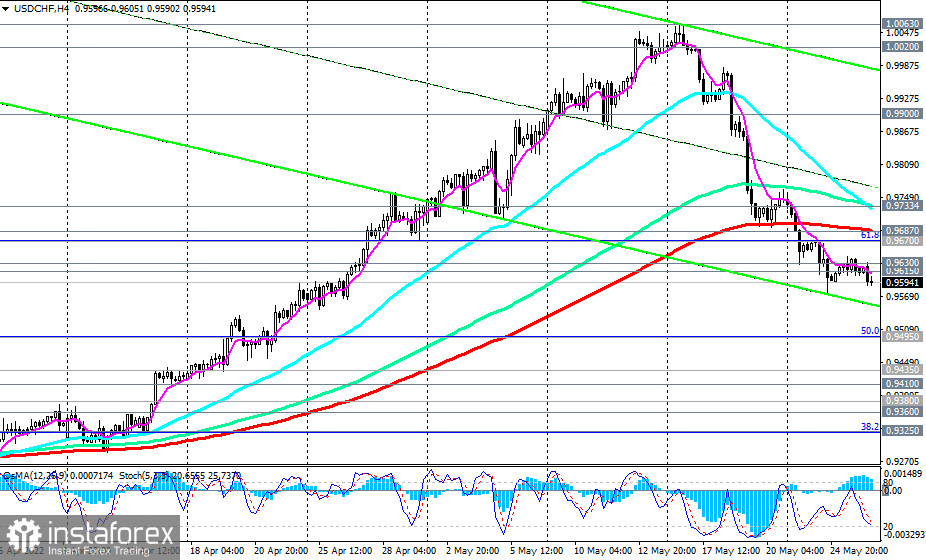
If, as we assumed, there is a rebound from the current support levels, then the first ("fast") signal for entering long positions will be a breakdown of the local resistance levels at 0.9630, 0.9642, and the confirming one will be a breakdown of the resistance levels at 0.9687 (200 EMA on the 4-hour chart), and 0.9733 (200 EMA on the 1-hour chart).
In an alternative scenario, and if the fundamental background still pushes the USD/CHF quotes lower, the downward correction may continue up to the support levels 0.9435 (200 EMA on the weekly chart), and 0.9410 (144 EMA on the daily chart).
A breakdown of support levels 0.9360 (200 EMA on the daily chart), and 0.9325 (38.2% Fibonacci retracement of the upward correction to the downward wave that began in April 2019 near 1.0235) may once again push USD/CHF into the bear market zone.
It should be noted that today's publication (at 12:30 GMT) of the report of the US Bureau of Economic Analysis with data on the country's GDP can become a new driver of movement.
Support levels: 0.9615, 0.9595, 0.9500, 0.9495, 0.9435, 0.9410, 0.9380, 0.9360, 0.9325, 0.9300
Resistance levels: 0.9630, 0.9642, 0.9670, 0.9687, 0.9733, 0.9900, 1.0000, 1.0020, 1.0063
Trading tips
Sell Stop – 0.9565. Stop-Loss – 0.9655. Take-Profit –0.9500, 0.9495, 0.9435, 0.9410, 0.9380, 0.9360, 0.9325, 0.9300
Buy Stop – 0.9655. Stop-Loss – 0.9565. Take-Profit – 0.9670, 0.9687, 0.9733, 0.9900, 1.0000, 1.0020, 1.0063
*บทวิเคราะห์ในตลาดที่มีการโพสต์ตรงนี้ เพียงเพื่อทำให้คุณทราบถึงข้อมูล ไม่ได้เป็นการเจาะจงถึงขั้นตอนให้คุณทำการซื้อขายตาม
บทวิเคราะห์ของทาง InstaSpot จะทำให้คุณทราบถึงแนวโน้มของตลาด! ในการที่เป็นลูกค้าของทาง InstaSpot นั้นคุณจะได้รับการบริการเพื่อการซื้อขายอย่างเต็มประสิทธิภาพอย่างมากมาย


