


Đội ngũ của chúng tôi có hơn 7,000,000 thương nhân!
Hàng ngày chúng tôi làm việc cùng nhau để cải thiện việc giao dịch. Chúng tôi nhận được kết quả cao và luôn tiến lên phía trước.
Sự công nhận của hàng triệu thương nhân trên toàn thế giới là sự đánh giá tốt nhất cho công việc của chúng tôi! Bạn đã đưa ra quyết định của mình và chúng tôi sẽ làm mọi thứ cần thiết để đáp ứng mong đợi của bạn!
Chúng ta cùng với nhau sẽ là một nhóm tuyệt vời!
InstaSpot. Tự hào làm việc cho bạn!


Diễn viên, nhà vô địch mùa giải UFC 6 và là người hùng thật sự!
Người tự mình làm nên tất cả. Người đàn ông đáng kể học hỏi.
Bí mật đằng sau thành công của Taktarov là sự cố gắng liên tục hướng tới mục tiêu.
Hãy khai phá tất cả các mặt tài năng của bạn!
Khám phá, thử, thất bại - nhưng không bao giờ dừng lại!
InstaSpot. Câu chuyện thành công của bạn bắt đầu từ đây!
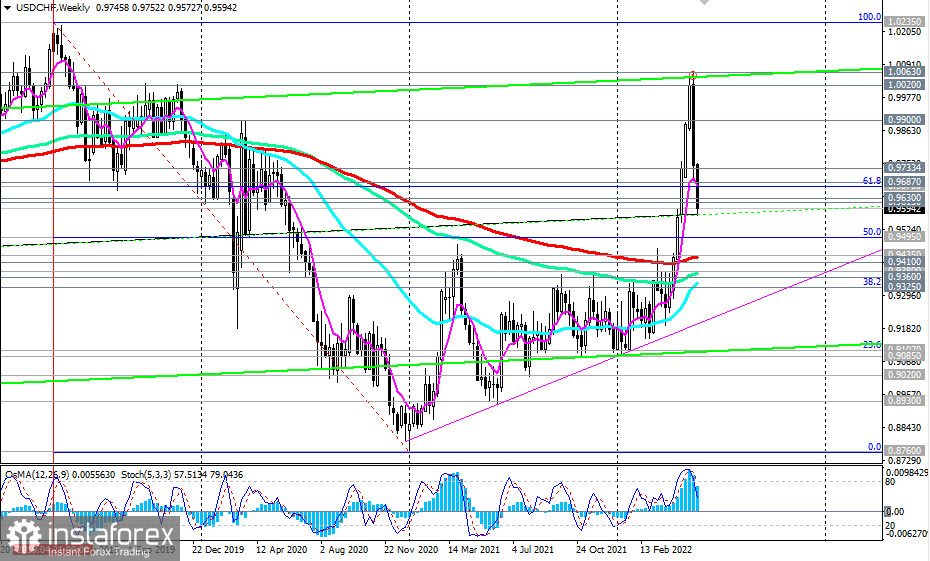
USD/CHF is trading near 0.9592 as of this writing, down from a nearly 2-week high at 1.0020.
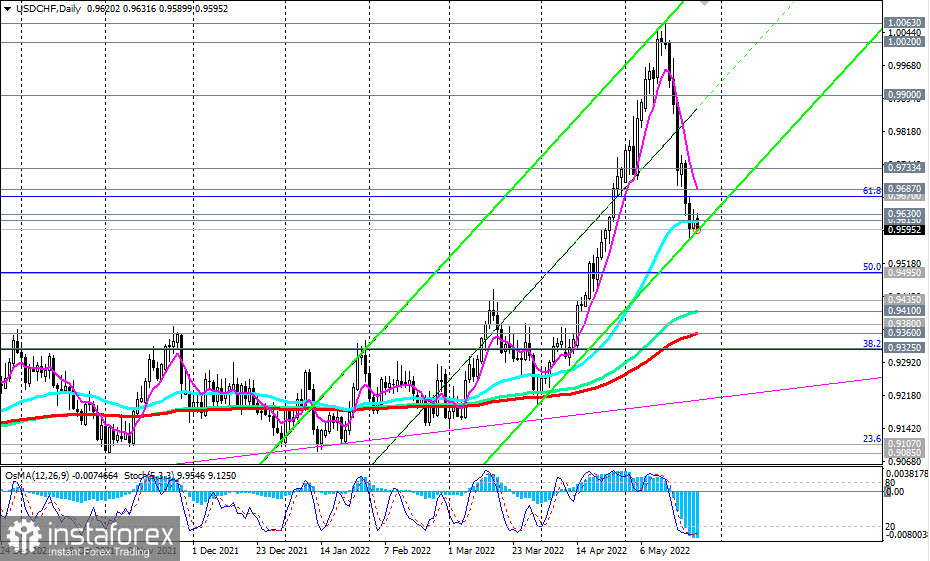
Despite the decline, the long-term upward trend of USD/CHF remains, while the pair reached important support levels at 0.9615 (50 EMA on the daily chart), and 0.9595 (the lower limit of the ascending channel on the daily chart), from which a rebound and resumption of growth is possible.
A strong upward impulse prevails, which is provided primarily by the prospects for further strengthening of the dollar against the backdrop of the Fed's monetary policy, the most aggressive in comparison with the policies of other major world central banks.
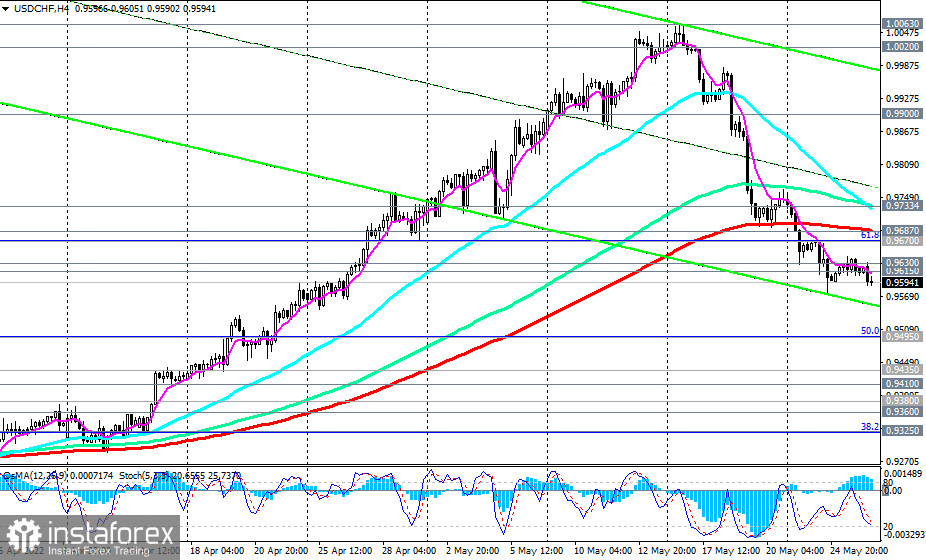
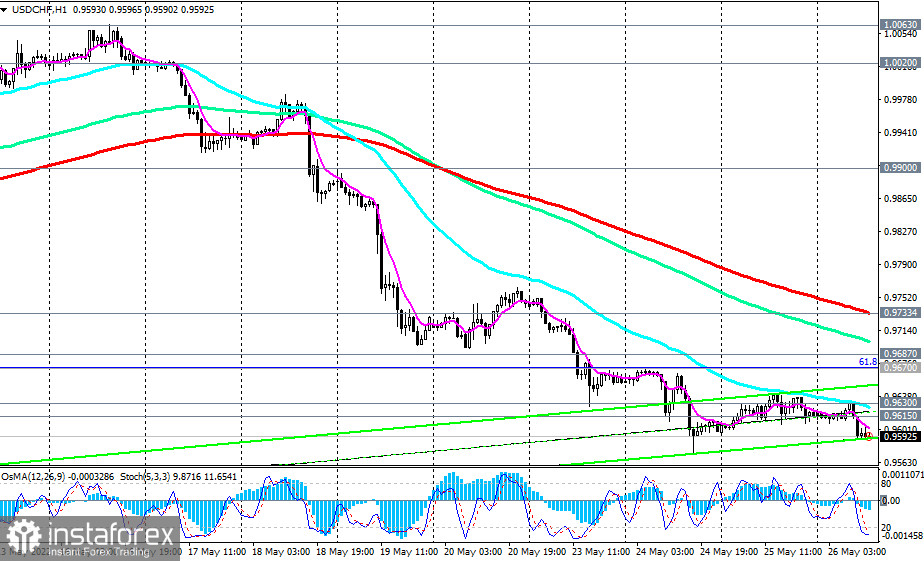
If, as we assumed, there is a rebound from the current support levels, then the first ("fast") signal for entering long positions will be a breakdown of the local resistance levels at 0.9630, 0.9642, and the confirming one will be a breakdown of the resistance levels at 0.9687 (200 EMA on the 4-hour chart), and 0.9733 (200 EMA on the 1-hour chart).
In an alternative scenario, and if the fundamental background still pushes the USD/CHF quotes lower, the downward correction may continue up to the support levels 0.9435 (200 EMA on the weekly chart), and 0.9410 (144 EMA on the daily chart).
A breakdown of support levels 0.9360 (200 EMA on the daily chart), and 0.9325 (38.2% Fibonacci retracement of the upward correction to the downward wave that began in April 2019 near 1.0235) may once again push USD/CHF into the bear market zone.
It should be noted that today's publication (at 12:30 GMT) of the report of the US Bureau of Economic Analysis with data on the country's GDP can become a new driver of movement.
Support levels: 0.9615, 0.9595, 0.9500, 0.9495, 0.9435, 0.9410, 0.9380, 0.9360, 0.9325, 0.9300
Resistance levels: 0.9630, 0.9642, 0.9670, 0.9687, 0.9733, 0.9900, 1.0000, 1.0020, 1.0063
Trading tips
Sell Stop – 0.9565. Stop-Loss – 0.9655. Take-Profit –0.9500, 0.9495, 0.9435, 0.9410, 0.9380, 0.9360, 0.9325, 0.9300
Buy Stop – 0.9655. Stop-Loss – 0.9565. Take-Profit – 0.9670, 0.9687, 0.9733, 0.9900, 1.0000, 1.0020, 1.0063
*Phân tích thị trường được đăng tải ở đây có nghĩa là để gia tăng nhận thức của bạn, nhưng không đưa ra các chỉ dẫn để thực hiện một giao dịch.
InstaSpot analytical reviews will make you fully aware of market trends! Being an InstaSpot client, you are provided with a large number of free services for efficient trading.


