




Our team has over 7,000,000 traders!
Every day we work together to improve trading. We get high results and move forward.
Recognition by millions of traders all over the world is the best appreciation of our work! You made your choice and we will do everything it takes to meet your expectations!
We are a great team together!
InstaSpot. Proud to work for you!





Actor, UFC 6 tournament champion and a true hero!
The man who made himself. The man that goes our way.
The secret behind Taktarov's success is constant movement towards the goal.
Reveal all the sides of your talent!
Discover, try, fail - but never stop!
InstaSpot. Your success story starts here!

Fear makes things look bigger than they are. Concerns about the start of the Fed's tightening cycle forced the S&P 500 to pull back, but the broad index quickly recovered and moved higher. There is clearly negative pressure for stocks from rising interest rates, yet the near-term direction hinges on one key question: can the economy withstand higher borrowing costs?
S&P 500 and Treasury yields dynamics
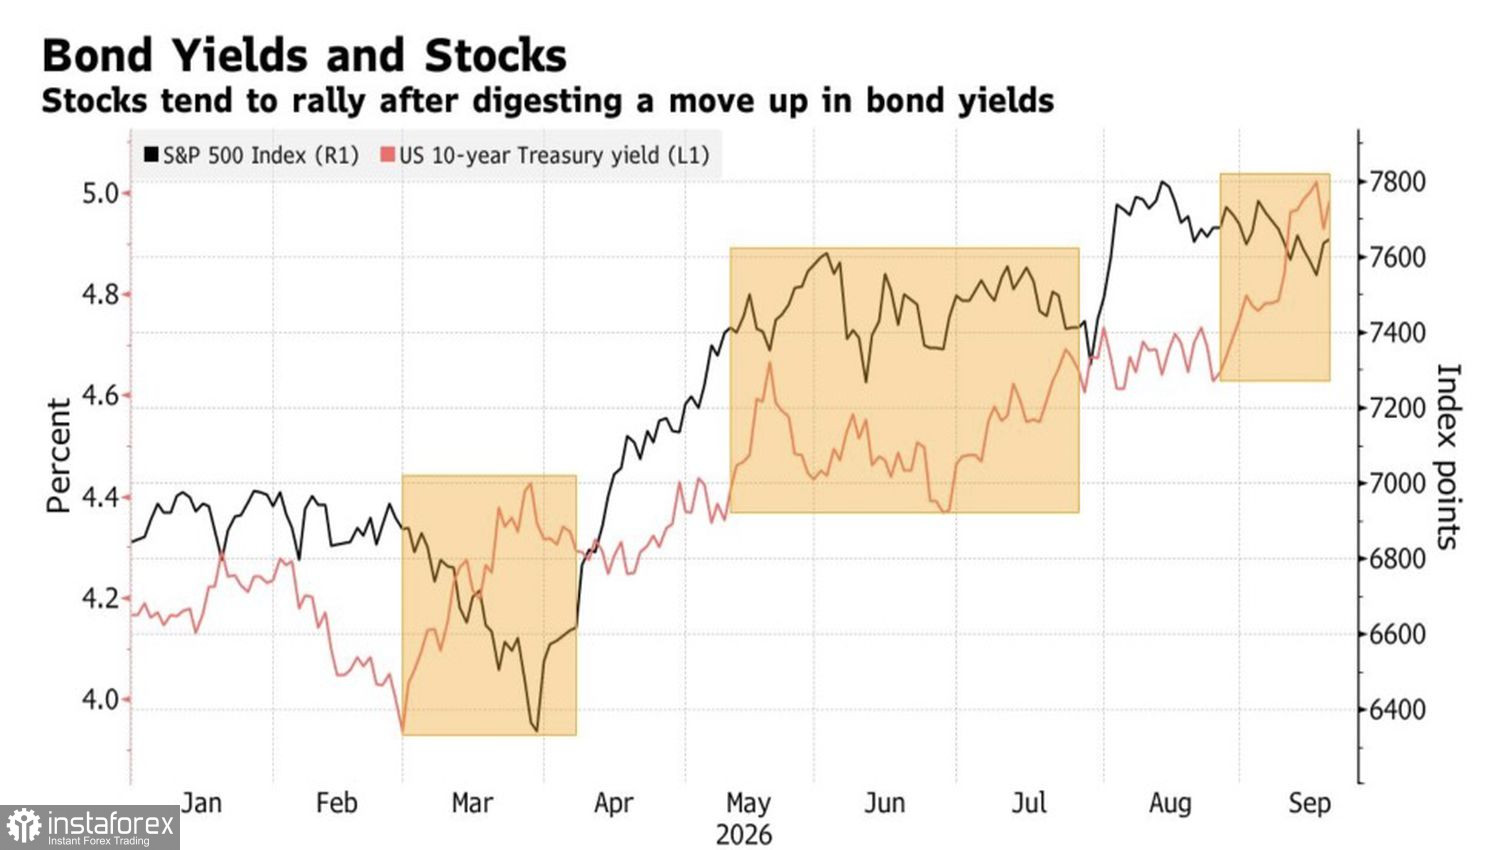
At first glance, monetary tightening makes credit more expensive, weakens business activity, pushes bond yields up, and raises companies' costs. That hits household purchasing power and corporate profits. In practice, however, higher interest rates around the world signal economic strength. And the fact that the S&P 500 has not collapsed in response to the start of the Fed's rate cycle suggests investors still trust equities and the companies that issue them.
Indeed, Goldman Sachs argues there is no case to call corporate earnings a bubble. Earnings grew by roughly 30% in each of the first two quarters, marking one of the strongest showings historically. The bank sees the rally as driven by US economic strength and an AI investment boom. That boosts productivity, which translates into higher tax receipts and faster GDP growth.
S&P 500 earnings dynamics
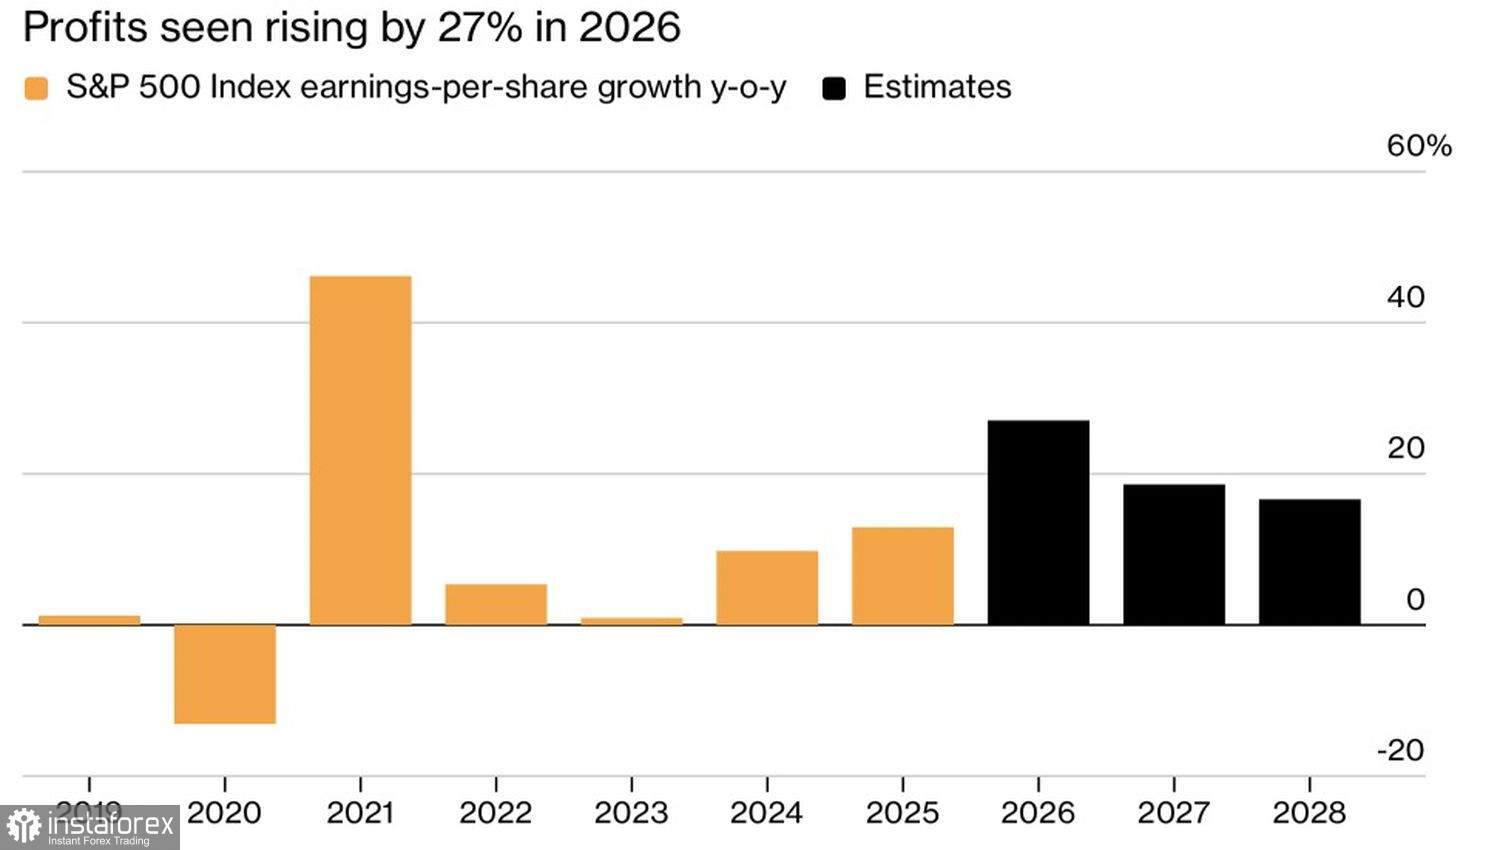
Goldman Sachs expects corporate earnings to slow, not to collapse. Strong results from S&P 500 issuers combined with a solid economy create conditions for the index rally to continue, especially given that investors have not been this bearish toward US equities in a long time.
According to the American Association of Individual Investors survey, about 53.3% of respondents now identify as bears and only 28.8% as bulls, the lowest bullish reading in a year. The 24.5% gap between bears and bulls is the widest since May 2025 and well above the long-run average of -6.5%. Respondents cite high energy prices and the start of Fed tightening as the main reasons for their pessimism about S&P 500 prospects.
Clearly, a bullish oil market with a risk of Brent surging above $120/bbl would keep pressure on the Fed to tighten aggressively and would cap the S&P 500's upside. Still, the broad index has strong fundamentals on its side: a resilient economy and impressive corporate profits.
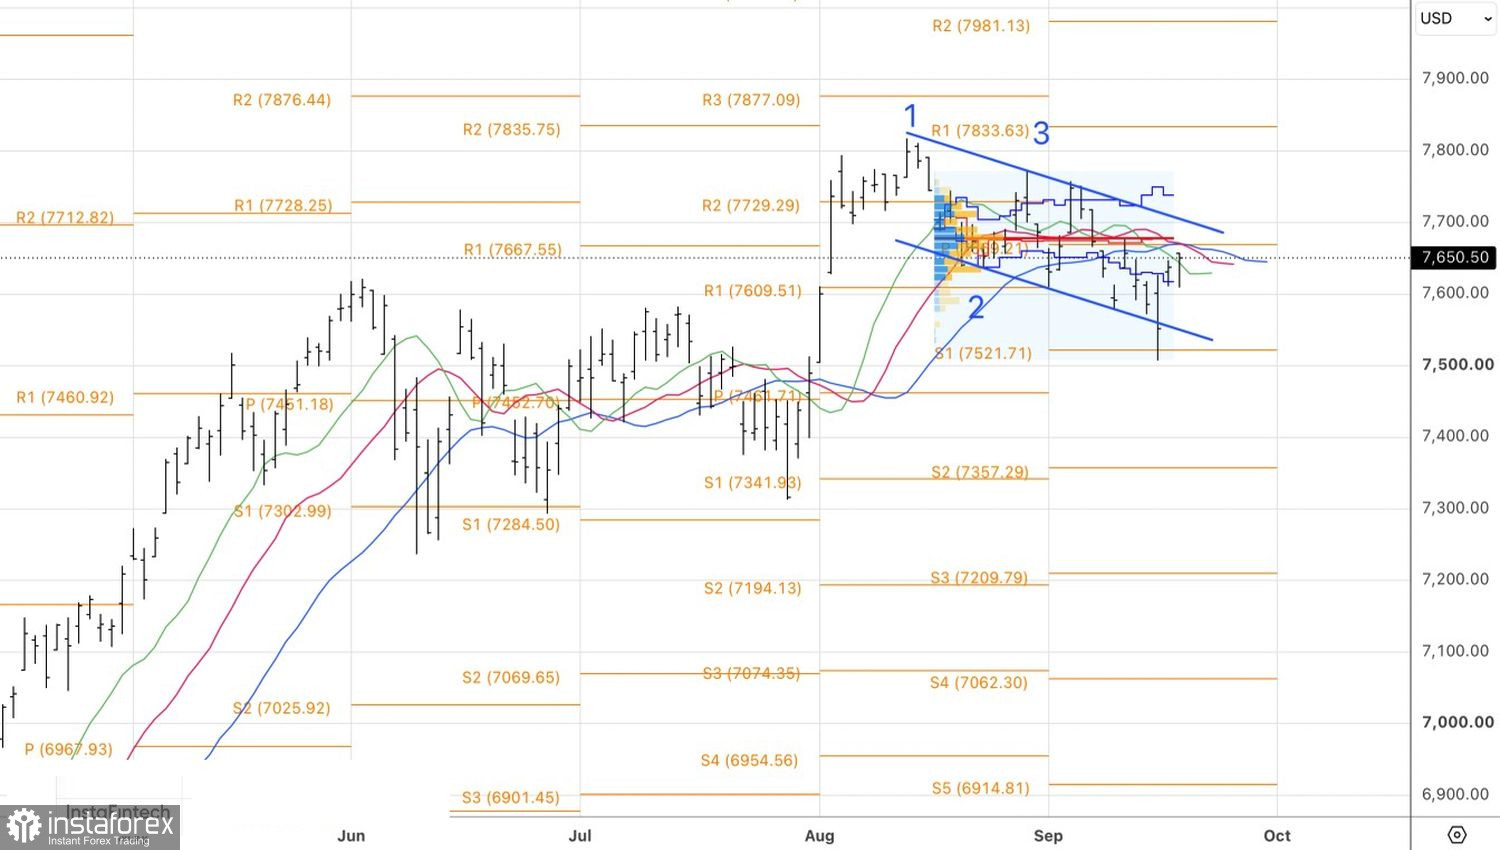
Technically, the daily chart shows that the S&P 500 has formed a bar with a long lower shadow, signaling bull strength and supporting the idea of adding to long positions established on a rebound from the 7,560 mark.
*The market analysis posted here is meant to increase your awareness, but not to give instructions to make a trade.
InstaSpot analytical reviews will make you fully aware of market trends! Being an InstaSpot client, you are provided with a large number of free services for efficient trading.


