




Our team has over 7,000,000 traders!
Every day we work together to improve trading. We get high results and move forward.
Recognition by millions of traders all over the world is the best appreciation of our work! You made your choice and we will do everything it takes to meet your expectations!
We are a great team together!
InstaSpot. Proud to work for you!





Actor, UFC 6 tournament champion and a true hero!
The man who made himself. The man that goes our way.
The secret behind Taktarov's success is constant movement towards the goal.
Reveal all the sides of your talent!
Discover, try, fail - but never stop!
InstaSpot. Your success story starts here!

Bitcoin is trying to hold above $79,000, trading around $79,310.60 with a 1.17% daily gain, but the threat of a further drop has not gone away. The reason is inflation.
Brent crude jumped nearly to $100 per barrel after Houthi attacks on Saudi energy facilities on Tuesday forced some plants to halt operations, and the spot price briefly touched $101 before European trading opened. That's beneficial for oil exporters and the Houthis, who achieved geopolitical resonance. Still, it hurts Bitcoin investors who were betting on a near-term Fed easing, since higher energy prices historically push inflation expectations up before they show up in official statistics.

This creates a timing gap that is particularly inconvenient for the market. The August consumer-price index will be released on September 11, but the Bureau of Labor Statistics' calendar measures prices for August and therefore cannot physically reflect the attack that occurred on September 8. The September inflation report will not appear until October 14 — notably after the Fed meeting on September 15–16. As a result, the regulator will make its rate decision based on data that describe conditions prior to Tuesday's strike on Saudi infrastructure, not the true energy-market picture at the time of the vote.
For the crypto market, this lag between backwards-looking statistics and a forward-looking energy shock creates a very awkward fork right before the Fed meeting. If the committee votes to hold or hike rates based on August data that do not yet reflect higher oil prices, the market risks getting a decision that is outdated from the moment it is announced — meaning any subsequent confirmation of higher inflation in the September CPI on October 14 could trigger a sharp retrospective repricing of expectations. That is why Bitcoin's current advance looks vulnerable not so much because of the Fed decision itself on September 16, but because the market may first cheer a dovish signal and then be forced to unwind that optimism once the data finally catch up with the energy-market reality.
If oil prices fall from the $100-per-barrel area and attacks on Iranian-related infrastructure cease, however, I expect the market could show another wave of gains as traders price in a less hawkish Fed.
Short-term trading strategy and conditions are described below.
Bitcoin expanded its range today to $78,600–79,700, and the trading day revolves around two mirror strategies: breakout plays at the borders and working off bounces inside the channel.
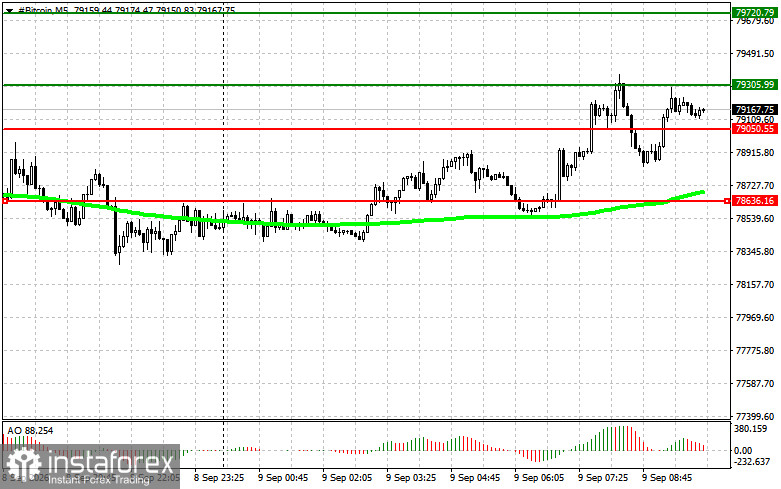
Buy scenario 1: Enter near $79,300 on a confident move above that level, with a profit target of $79,700. It makes sense to close the long there and almost immediately consider a short on the pullback, because breakout impulses rarely continue far without a pause at the next resistance. Both conditions must be met to enter: price must stay above the 50?day moving average (confirming the bullish background), and the Awesome Oscillator must remain in positive territory, showing buyers are not exhausted.
Buy scenario 2: Buy from the lower boundary at $78,600 if a move below is not confirmed by further declines — treat that as a false breakout and open a long with targets first at $79,000 and then $79,700.
Sell strategies are the mirror image.
Short scenario 1: A confirmed break below $79,000 opens a short targeting $78,600, where you should take profit and reverse into a buy on the expected rebound, since declines also need a breather after strong moves. Entry conditions are opposite to those for longs: the moving average should be above price and the Awesome Oscillator below zero.
Short scenario 2: Go short from the upper band at $79,300 if there is no follow-through to the upside; this opens the way sequentially to the lower targets, $79,000 and then $78,600.
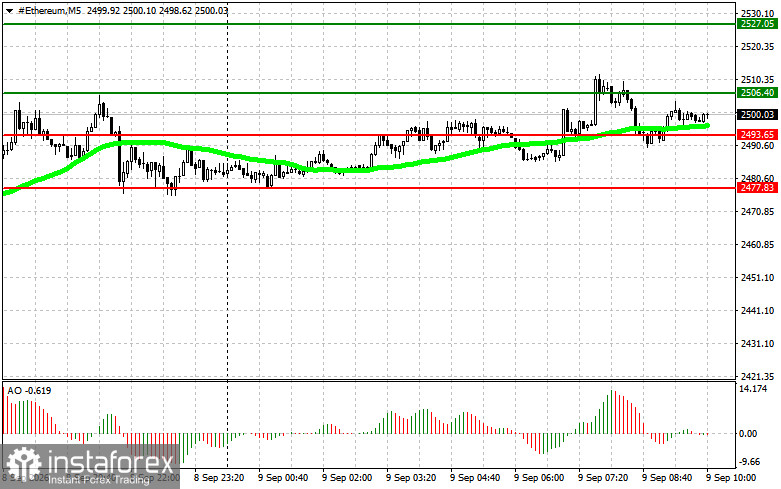
Ethereum is trading in the $2,477–2,506 range, and the same logic applies.
A break above $2,493 signals a buy with a target at $2,506, where profits should be taken and a short considered if conditions are met (rising moving average below price and Awesome positive).
From the lower band at $2,477, if a breakdown is not confirmed, open a long targeting $2,493 and then $2,506.
Sell ETH:
Go short from $2,493 targeting $2,477; at that level, close short positions and buy during the bounce. Enter short positions only when price is below the moving average and the Awesome indicator is negative.
The second short variant is from the upper band at $2,506 if there is no reaction to an upside breakout, which would ultimately target the same two lower levels in sequence.
Both indicators serve only as filters to weed out false moves rather than standalone entry signals, so trades should be opened only after price confirms the specified levels.
*The market analysis posted here is meant to increase your awareness, but not to give instructions to make a trade.
InstaSpot analytical reviews will make you fully aware of market trends! Being an InstaSpot client, you are provided with a large number of free services for efficient trading.


