




The legend in the InstaSpot team!
Legend! You think that's bombastic rhetoric? But how should we call a man, who became the first Asian to win the junior world chess championship at 18 and who became the first Indian Grandmaster at 19? That was the start of a hard path to the World Champion title for Viswanathan Anand, the man who became a part of history of chess forever. Now one more legend in the InstaSpot team!





Borussia is one of the most titled football clubs in Germany, which has repeatedly proved to fans: the spirit of competition and leadership will certainly lead to success. Trade in the same way that sports professionals play the game: confidently and actively. Keep a "pass" from Borussia FC and be in the lead with InstaSpot!

Bitcoin has already fallen to $62,400 level and shows little sign of stopping there today. Meanwhile, Ethereum is trading at $1,840, below the key psychological $1,900 level.

As Bitcoin declines once again and appears to be preparing for another test of the $60,000 level, the Bitcoin network is experiencing one of the longest and deepest periods of declining computing power in its history. The network's hash rate has been falling for approximately 287 consecutive days, while mining difficulty has dropped 19.9% from its peak of 155.97 trillion, recorded in November 2025. This marks the third-deepest decline since specialized ASIC miners became the industry standard. Mining difficulty fell more sharply only after China's mining ban in 2021 and during the 2018 bear market.
Another notable metric is that mining difficulty has turned negative on a year-over-year basis for the first time in many years. This is only the second such occurrence in Bitcoin's history, with the previous instance also following China's mining ban.
According to some industry experts, the current miner capitulation is fundamentally different from that of 2021. Back then, a single government ban instantly removed roughly half of the world's computing power from the network. The current contraction has no single political trigger. Instead, it is the result of months of sustained pressure on mining profitability, lower Bitcoin prices, older and less efficient mining equipment being taken offline due to unprofitability, and, most importantly, the redirection of energy resources toward artificial intelligence and high-performance computing.
Against this backdrop, a striking paradox has emerged, making the current situation unlike previous industry cycles. A basket of publicly traded mining company stocks has gained 56% since the beginning of 2026, while Bitcoin itself has lost 17% over the same period. This divergence reinforces the view previously expressed by Michael Saylor regarding capital shifting toward AI infrastructure, as well as JPMorgan's assessment that miner capitulation could serve as a historically reliable contrarian indicator for Bitcoin prices.
As for short-term trading, the strategy and trading scenarios are outlined below.
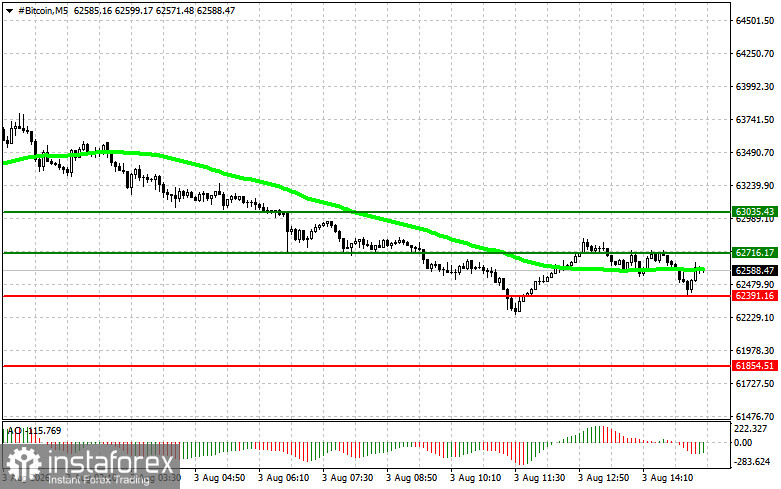
Scenario No. 1: I plan to buy Bitcoin if the price reaches the entry point around $62,700, targeting a move to $63,000. Around $63,000, I plan to close long positions and immediately sell on a rebound. Before buying on a breakout, make sure that the 50-day Moving Average is below the current price and that the Awesome Oscillator is above the zero line.
Scenario No. 2: Bitcoin can also be bought from the lower boundary of $62,400 if there is no sustained market reaction after a breakout below this level, targeting a recovery toward $62,700 and $63,000.
Scenario No. 1: I plan to sell Bitcoin if the price reaches the entry point around $62,400, targeting a decline to $61,800. Around $61,800, I plan to close short positions and immediately buy on a rebound. Before selling on a breakout, make sure that the 50-day Moving Average is above the current price and that the Awesome Oscillator is below the zero line.
Scenario No. 2: Bitcoin can also be sold from the upper boundary of $62,700 if there is no sustained market reaction after a breakout above this level, targeting a move back toward $62,400 and $61,800.
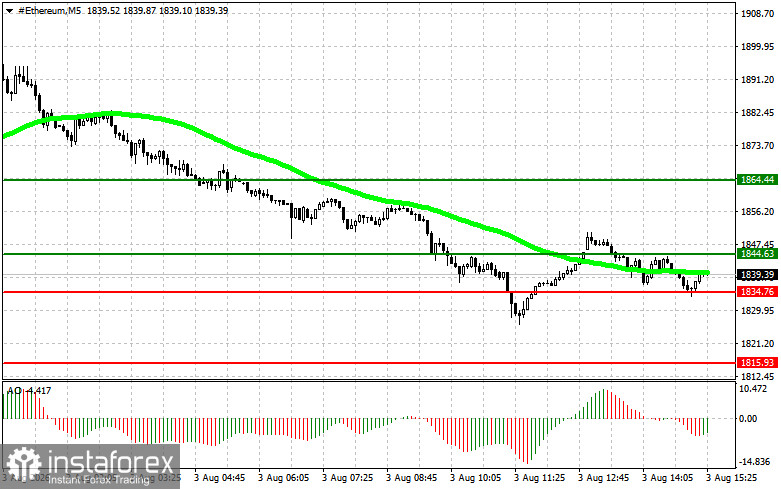
Scenario No. 1: I plan to buy Ethereum if the price reaches the entry point around $1,844, targeting a move to $1,864. Around $1,864, I plan to close long positions and immediately sell on a rebound. Before buying on a breakout, make sure that the 50-day Moving Average is below the current price and that the Awesome Oscillator is above the zero line.
Scenario No. 2: Ethereum can also be bought from the lower boundary of $1,834 if there is no sustained market reaction after a breakout below this level, targeting a recovery toward $1,844 and $1,864.
Scenario No. 1: I plan to sell Ethereum if the price reaches the entry point around $1,834, targeting a decline to $1,815. Around $1,815, I plan to close short positions and immediately buy on a rebound. Before selling on a breakout, make sure that the 50-day Moving Average is above the current price and that the Awesome Oscillator is below the zero line.
Scenario No. 2: Ethereum can also be sold from the upper boundary of $1,844 if there is no sustained market reaction after a breakout above this level, targeting a move back toward $1,834 and $1,815.
*The market analysis posted here is meant to increase your awareness, but not to give instructions to make a trade.
InstaSpot analytical reviews will make you fully aware of market trends! Being an InstaSpot client, you are provided with a large number of free services for efficient trading.


