


Our team has over 7,000,000 traders!
Every day we work together to improve trading. We get high results and move forward.
Recognition by millions of traders all over the world is the best appreciation of our work! You made your choice and we will do everything it takes to meet your expectations!
We are a great team together!
InstaSpot. Proud to work for you!


Actor, UFC 6 tournament champion and a true hero!
The man who made himself. The man that goes our way.
The secret behind Taktarov's success is constant movement towards the goal.
Reveal all the sides of your talent!
Discover, try, fail - but never stop!
InstaSpot. Your success story starts here!

The GBP/USD currency pair also corrected slightly, but in the first half of the day, it intended to continue its decline. Help came from a package of data from the U.S., where two out of three reports were neutral to negative. The core personal consumption expenditures price index was at 0.3%, showing neither acceleration nor exceeding the forecast, while the durable goods orders report fell by 4.5%, just as the market expected. The only report that surprised was the U.S. GDP for the first quarter. The third estimate showed that the U.S. economy grew not by 1.6%, but by 2.1%, which should have provoked a rise in the dollar... but it did not. Instead, we witnessed another "logical movement" – upwards. However, it did not last long. Thus, we can once again conclude that the current movements are completely illogical, as is the market's disregard for macroeconomics, fundamentals, and geopolitics. At this moment, there is no talk of even a correction for the British pound – the pair cannot overcome the critical line.
From a technical perspective, the downward trend continues as the market persists. The area of 1.3179-1.3187 halted the decline of the British currency for a few days, but ultimately could not withstand pressure from above. The decline may well continue for technical reasons. A price consolidation above the critical line would provide hope for at least a correction.
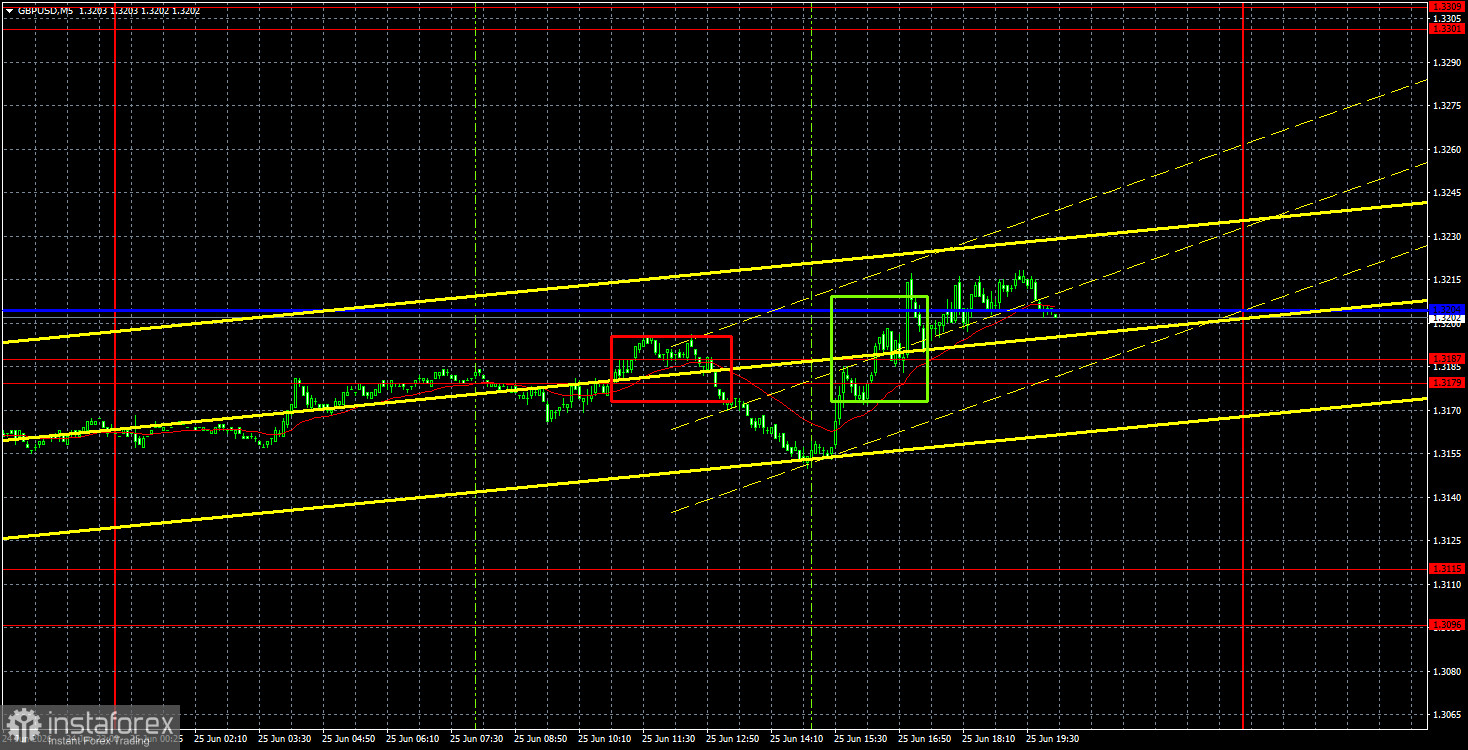
On the 5-minute timeframe, two trading signals were formed on Thursday, both of which left much to be desired. The first sell signal in the area of 1.3179-1.3204 allowed for short positions, but the price moved down only 18 pips. The second buy signal in the same area is difficult to even label as a signal, as it is absolutely unclear whether the price consolidated above the Kijun-sen line.
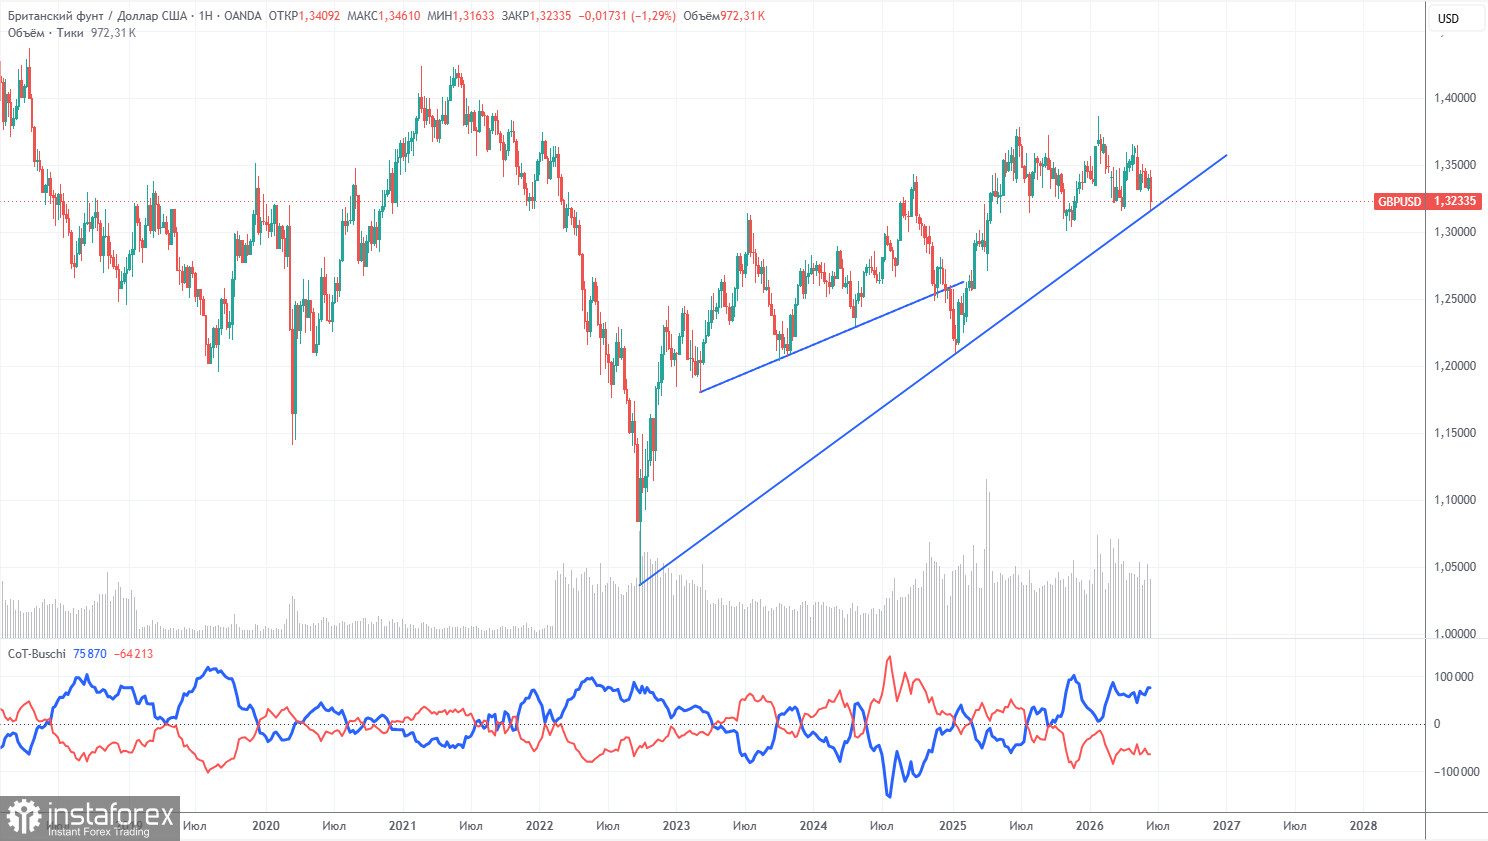
COT reports on the British pound show that in recent years, commercial traders' sentiment has been constantly changing. The red and blue lines, which represent the net positions of commercial and non-commercial traders, frequently intersect and are generally close to the zero mark. Currently, the lines are moving apart, with non-commercial traders still dominating... in terms of sales. Given the events in the Middle East, it is no surprise that demand for risk currencies is low.
In the long term, the dollar continues to decline due to Donald Trump's policies, which is clearly visible on the weekly timeframe (illustration above). The trade war will continue in one form or another for a long time, and Trump's policies are aimed directly and indirectly at weakening the U.S. currency. However, at this point, geopolitical factors are paramount, which have recently provided strong support to the dollar. Since the conflict in the Middle East remains unresolved, the U.S. dollar may continue to strengthen. According to the latest COT report (dated June 9), the "Non-commercial" group closed 7,900 BUY contracts and opened 4,000 SELL contracts. Thus, the net position of non-commercial traders decreased by 11,900 contracts over the week.
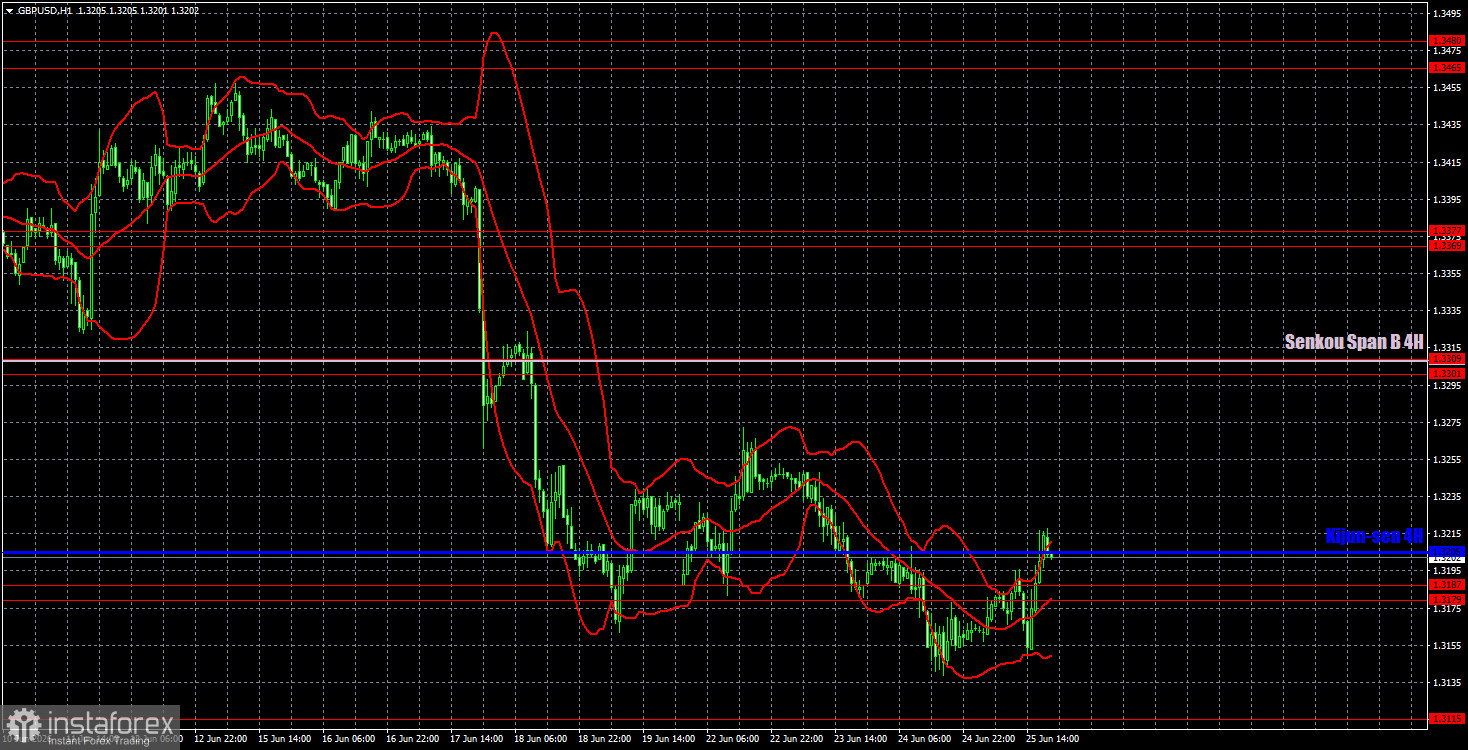
On the hourly timeframe, the GBP/USD pair continues its downward trend, which does not align with the current fundamental and geopolitical backdrop. However, the market has been ignoring both fundamentals and macroeconomics for three months, and now it is ignoring geopolitics and selectively focusing on factors. We do not believe that the recent decline in the British currency is justified.
For June 26, we highlight the following important levels: 1.3042-1.3050, 1.3096-1.3115, 1.3179-1.3187, 1.3301-1.3309, 1.3369-1.3377, 1.3465-1.3480, 1.3588, 1.3671-1.3681. The Senkou Span B line (1.3310) and the Kijun-sen line (1.3205) may also serve as sources of signals. It is recommended to set the Stop Loss level to breakeven after the price moves in the right direction by 20 pips. The Ichimoku indicator lines may move throughout the day, which should be considered when determining trading signals.
On Friday, no important reports or events are scheduled in the UK, while the U.S. will release a consumer sentiment index from the University of Michigan. We do not believe this index will significantly affect the pair's movement, as the market continues to ignore most macroeconomic events.
Today, traders may consider short positions with targets of 1.3096-1.3115 if the pair consolidates below the 1.3179-1.3187 area. Long positions will become relevant if there is a consolidation above the critical line with a target of 1.3301-1.3309.
Support and resistance price levels – thick red lines, near which movement may end. They are not sources of trading signals.
Kijun-sen and Senkou Span B lines – lines of the Ichimoku indicator, transferred to the hourly timeframe from the 4-hour timeframe. They are strong lines.
Extreme levels – thin red lines from which the price previously rebounded. They are sources of trading signals.
Yellow lines – trend lines, trend channels, and any other technical patterns.
Indicator 1 on COT charts – the size of the net position of each category of traders.
*The market analysis posted here is meant to increase your awareness, but not to give instructions to make a trade.
InstaSpot analytical reviews will make you fully aware of market trends! Being an InstaSpot client, you are provided with a large number of free services for efficient trading.


