


Our team has over 7,000,000 traders!
Every day we work together to improve trading. We get high results and move forward.
Recognition by millions of traders all over the world is the best appreciation of our work! You made your choice and we will do everything it takes to meet your expectations!
We are a great team together!
InstaSpot. Proud to work for you!


Actor, UFC 6 tournament champion and a true hero!
The man who made himself. The man that goes our way.
The secret behind Taktarov's success is constant movement towards the goal.
Reveal all the sides of your talent!
Discover, try, fail - but never stop!
InstaSpot. Your success story starts here!

The escalation of the Middle East conflict forced the S&P 500 to retreat from record highs. However, the decline did not look like a cliff?edge drop. A full correction may not materialize because retail investors are ready to buy every dip. Even the futures rally in Brent for December delivery to levels not seen since the start of bombing in Iran hasn't spooked the stock index. Their correlation has become inversely opposed.
Correlation of S&P500 and oil prices
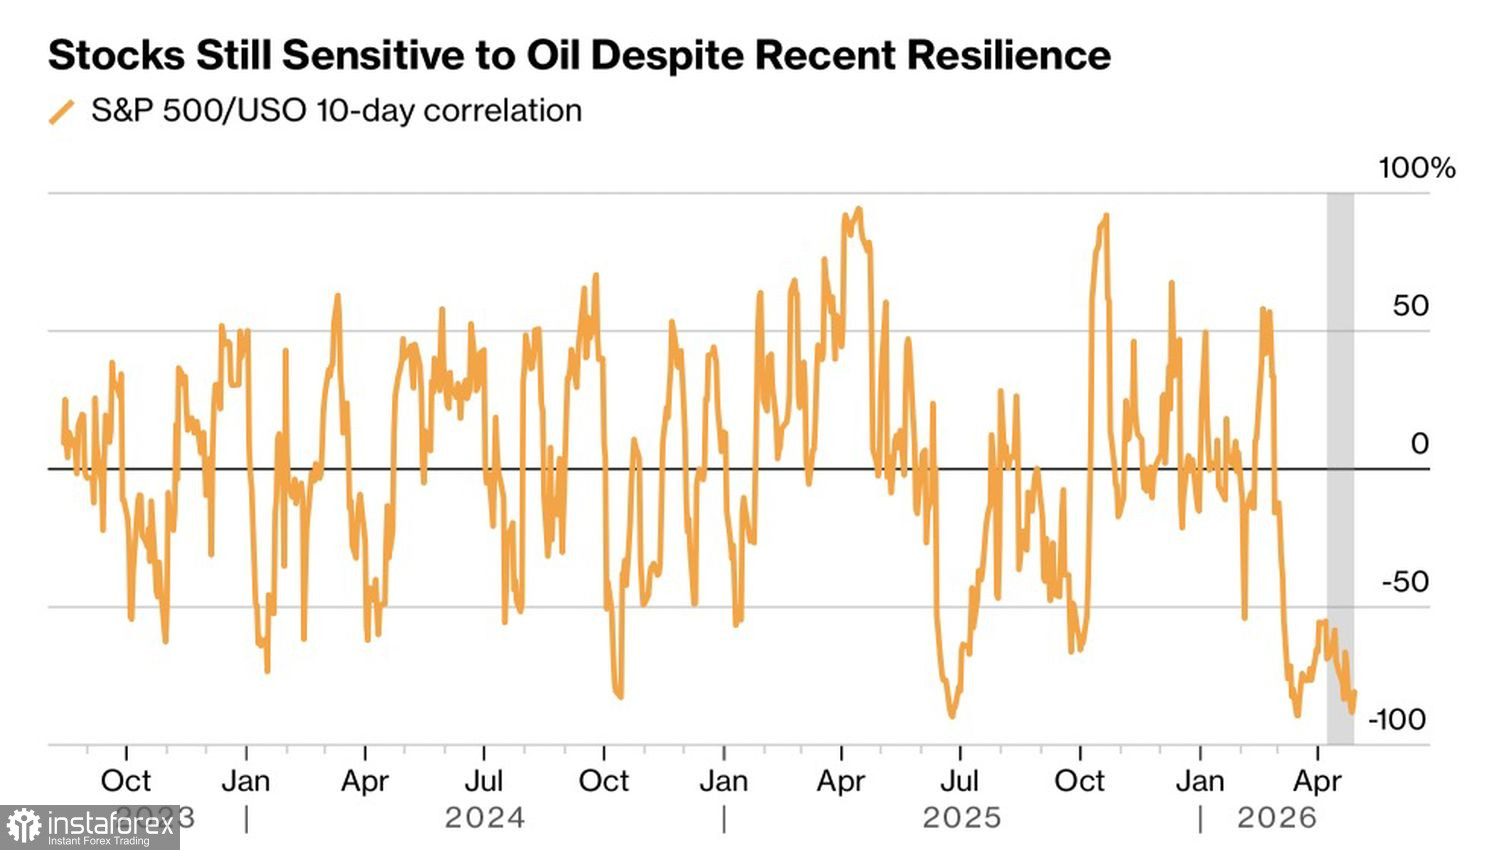
At first glance, it's weird. Rising oil prices push up corporate costs and reduce profits. It accelerates inflation via second-order effects, which forces the Fed to tighten policy, and the economy slows—this is the theory. In practice, S&P 500 corporate earnings are so large that bulls are not worried by higher input costs or higher rates.
Morgan Stanley believes strong corporate earnings will allow US companies to weather the energy crisis storm. In Q1, S&P 500 issuers reported a 6% positive earnings surprise per share, the best result in four years. Estimates for Q2 were raised by 2%, for the end of 2026 by 3%, and for the next 12 months by 4%.
Expected and actual results of S&P 500 companies
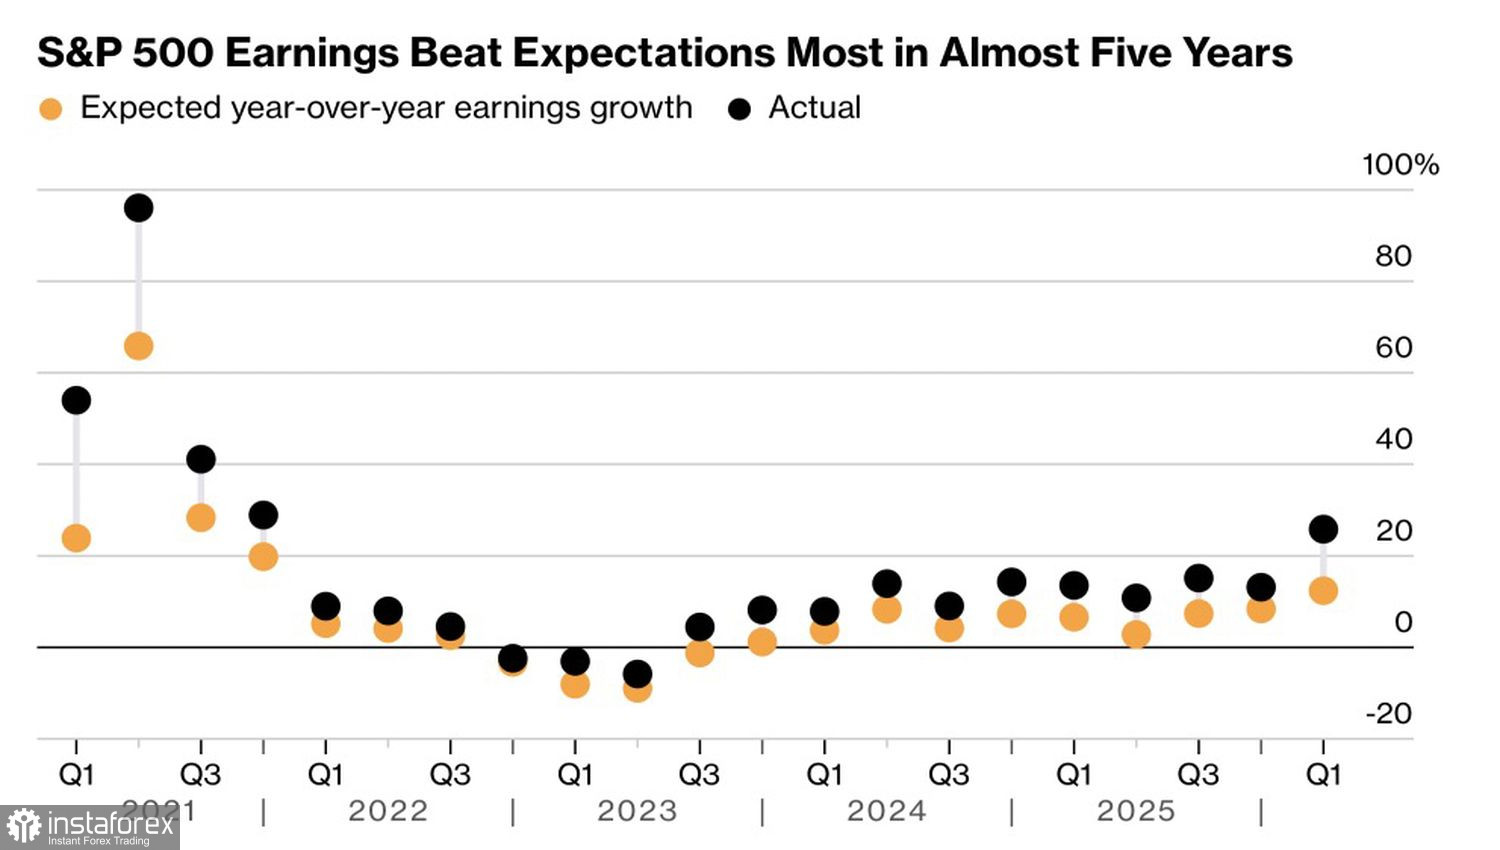
Deutsche Bank notes that earnings growth accelerated from 13.4% in Q4 to 24.6% in Q1 — the strongest pace at least since 2022. Back then, hopes around ChatGPT drove blockbuster expectations for tech revenues; now those expectations are being realized.
The stock rally contributes to US economic growth. Consumers feel wealthier and spend more even without wage growth. This is reflected in a fall in the savings rate from an average 6.2% of disposable income over the ten years before the pandemic to the current 3.6% — a worrying sign for Americans if a recession hits. But a downturn may not occur.
Meanwhile, the crowd is eager to buy any sell?off. According to the latest AAII survey, the share of respondents expecting a market decline within the next six months rose to 39.7% — above the historical average of 31%. Historically, when the market has more bears than usual, the broad stock index often gets room to rise.
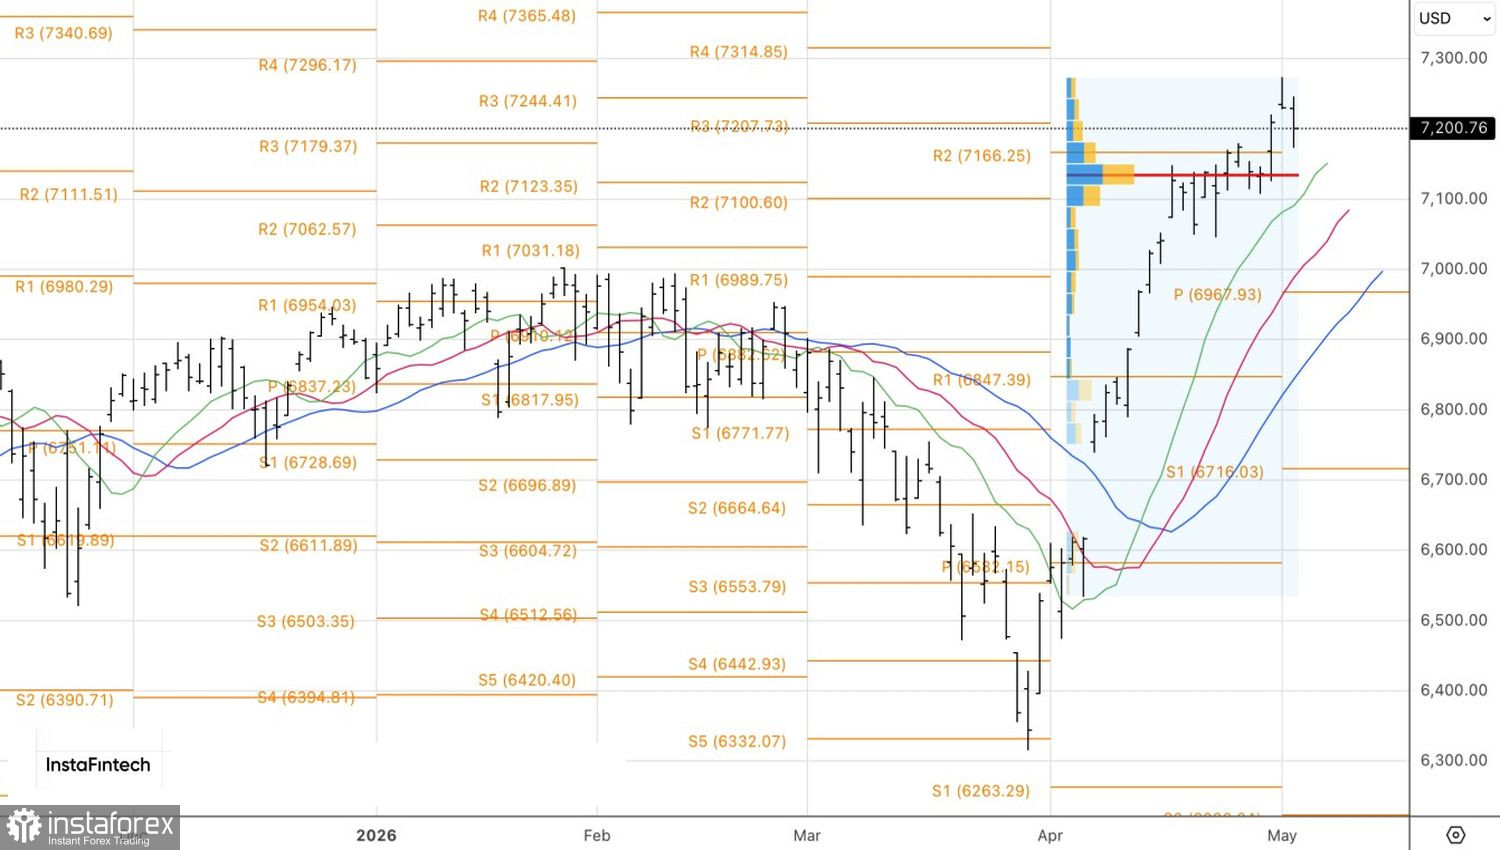
Technically, the daily chart of the S&P 500 formed a Shooting Star candlestick pattern. The average bar has a long upper wick, signaling bull weakness. A drop below 7,170 would allow short positions opened from 7,220 to be increased on the broad index. To return to buying, the index needs to rise above 7,240.
*The market analysis posted here is meant to increase your awareness, but not to give instructions to make a trade.
InstaSpot analytical reviews will make you fully aware of market trends! Being an InstaSpot client, you are provided with a large number of free services for efficient trading.


