


Our team has over 7,000,000 traders!
Every day we work together to improve trading. We get high results and move forward.
Recognition by millions of traders all over the world is the best appreciation of our work! You made your choice and we will do everything it takes to meet your expectations!
We are a great team together!
InstaSpot. Proud to work for you!


Actor, UFC 6 tournament champion and a true hero!
The man who made himself. The man that goes our way.
The secret behind Taktarov's success is constant movement towards the goal.
Reveal all the sides of your talent!
Discover, try, fail - but never stop!
InstaSpot. Your success story starts here!

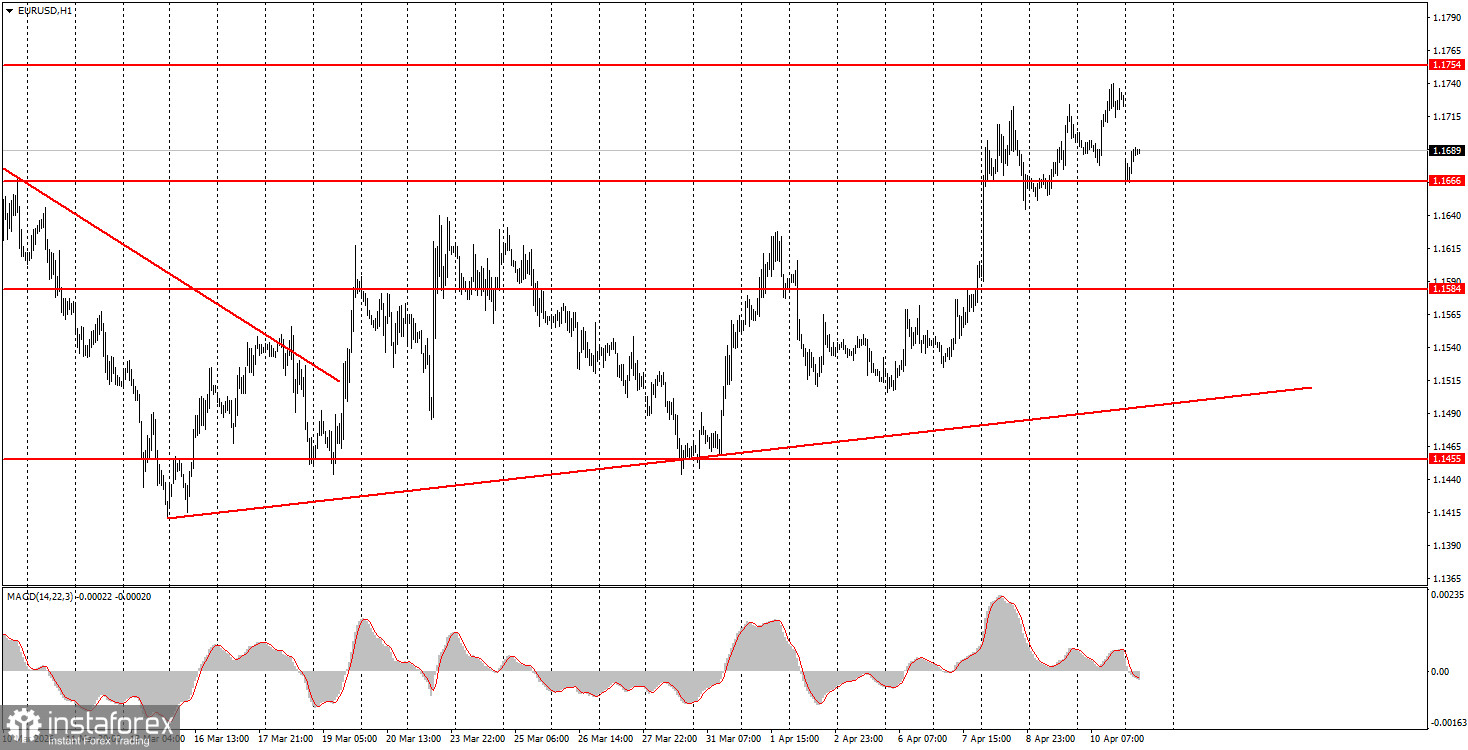
On the hourly timeframe, the upward trend remains intact, but geopolitical factors may pull the pair down again this week. The market is continuing to trade solely on events in the Middle East and emotions. Thus, the "roller coaster" may continue for quite a while, and macroeconomic, technical, and fundamental factors are of little significance. The failure of negotiations between Iran and the US may mean the dollar is prioritized again by traders.
On Monday, novice traders may consider short positions if the price consolidates below the 1.1655-1.1666 area, targeting 1.1584-1.1591. A new price bounce from the 1.1655-1.1666 area will allow for the opening of long positions with a target of 1.1745-1.1754.
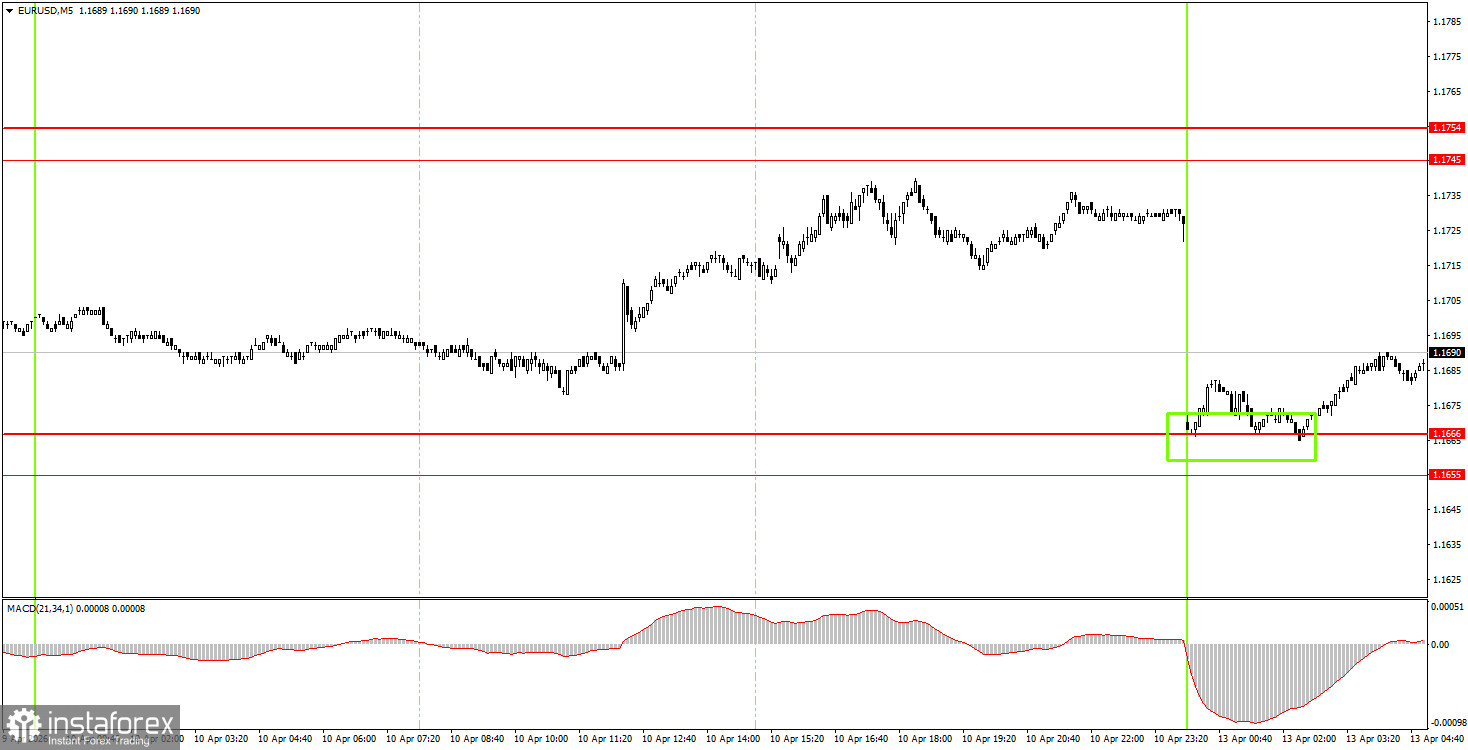
On the 5-minute timeframe, levels to consider are 1.1267-1.1292, 1.1354-1.1363, 1.1413, 1.1455-1.1474, 1.1527-1.1531, 1.1584-1.1591, 1.1655-1.1666, 1.1745-1.1754, 1.1830-1.1837, and 1.1899-1.1908. On Monday, there are no significant events or reports scheduled in the Eurozone, and in the US, only a secondary report on existing home sales will be released. Market attention will once again be entirely focused on geopolitical factors.
Price levels of support and resistance are levels that serve as targets when opening buys or sells. Take Profit levels can be placed around them.
Red lines represent channels or trend lines that show the current trend and indicate the direction in which it is preferable to trade now.
The MACD indicator (14,22,3) – the histogram and the signal line – is a supporting indicator that can also be used as a source of signals.
Important speeches and reports (always included in the news calendar) can significantly affect the movement of the currency pair. Therefore, during their release, trading should be done with utmost caution, or traders should exit the market to avoid sharp price reversals against the previous movement.
Beginning traders in the forex market should remember that not every trade can be profitable. Developing a clear strategy and effective money management are the keys to long-term trading success.
*The market analysis posted here is meant to increase your awareness, but not to give instructions to make a trade.
InstaSpot analytical reviews will make you fully aware of market trends! Being an InstaSpot client, you are provided with a large number of free services for efficient trading.


