


Our team has over 7,000,000 traders!
Every day we work together to improve trading. We get high results and move forward.
Recognition by millions of traders all over the world is the best appreciation of our work! You made your choice and we will do everything it takes to meet your expectations!
We are a great team together!
InstaSpot. Proud to work for you!


Actor, UFC 6 tournament champion and a true hero!
The man who made himself. The man that goes our way.
The secret behind Taktarov's success is constant movement towards the goal.
Reveal all the sides of your talent!
Discover, try, fail - but never stop!
InstaSpot. Your success story starts here!

The EUR/USD currency pair continued its nearly freefall on Tuesday. On Monday, we warned that forecasting the dollar's movement would now be more challenging than usual. The issue is that, at first glance, everything appears clear and straightforward—the war in the Middle East is already impacting the world through rising prices for gas, gasoline, and oil, leading investors to flee from risk assets into the dollar. However, in reality, the dollar cannot keep rising every day on the same event. There will come a time when all investors have moved their assets into dollars, and the American currency will have no further reasons to appreciate. When that moment arrives is unknown since investors do not publish reports about their actions. Thus, if a more severe escalation of the war in the Middle East does not occur, the dollar could start to correct as early as today. Recall that several important reports are set to be released in the US this week, and significant reports were also released in the US and EU in the first two days. The market certainly ignored them, but the labor market data will be difficult to overlook.
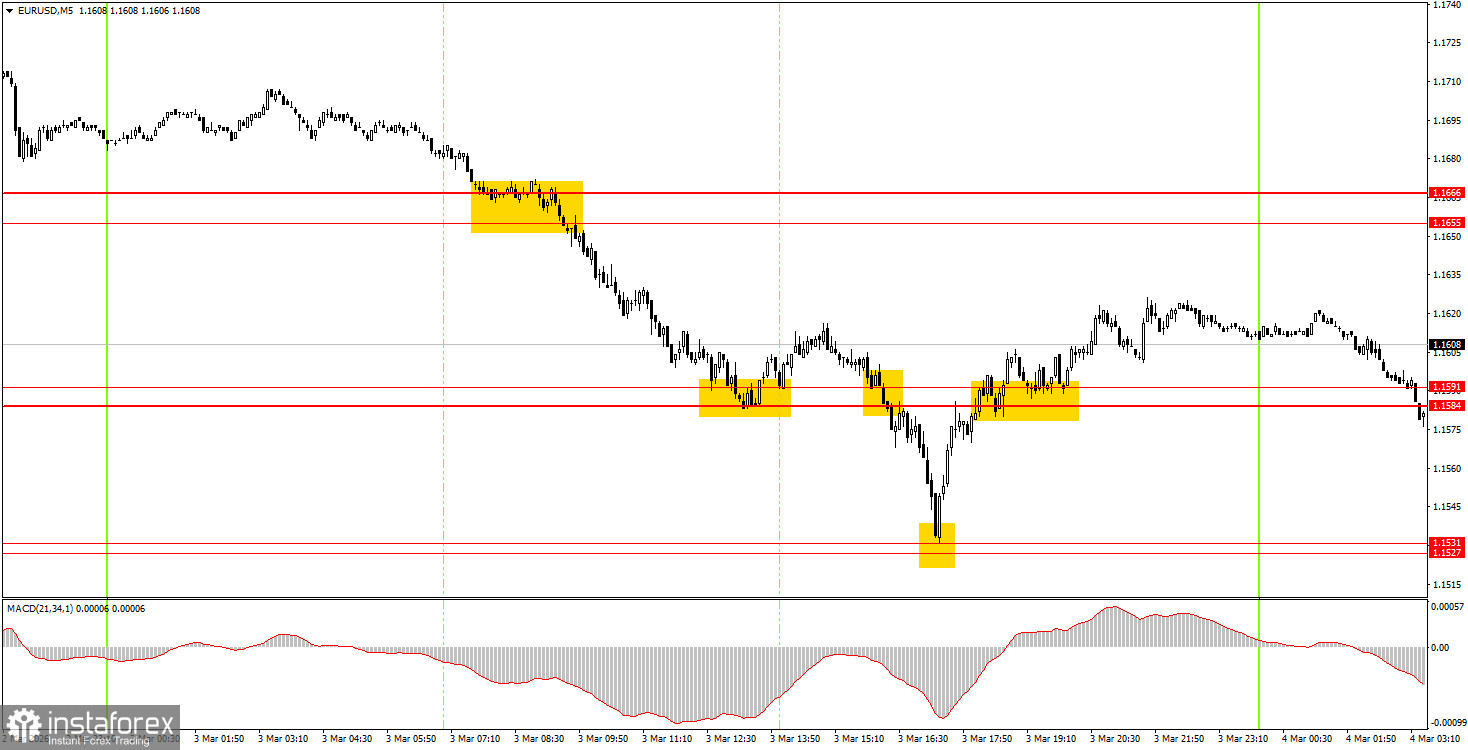
On the 5-minute timeframe, several signals were generated on Tuesday because movements in the market were strong for the second consecutive day. Almost all signals were profitable for traders. A sell signal was formed in the area of 1.1655-1.1666 during the European trading session, after which the price fell to the area of 1.1584-1.1591. A false buy signal formed near this area, but the price moved 15 pips higher. Next, a new sell signal appeared, leading to a drop to 1.1527-1.1531. A bounce from this zone allowed beginner traders to open long positions, which also closed with a good profit. In total, three out of four trades were profitable.
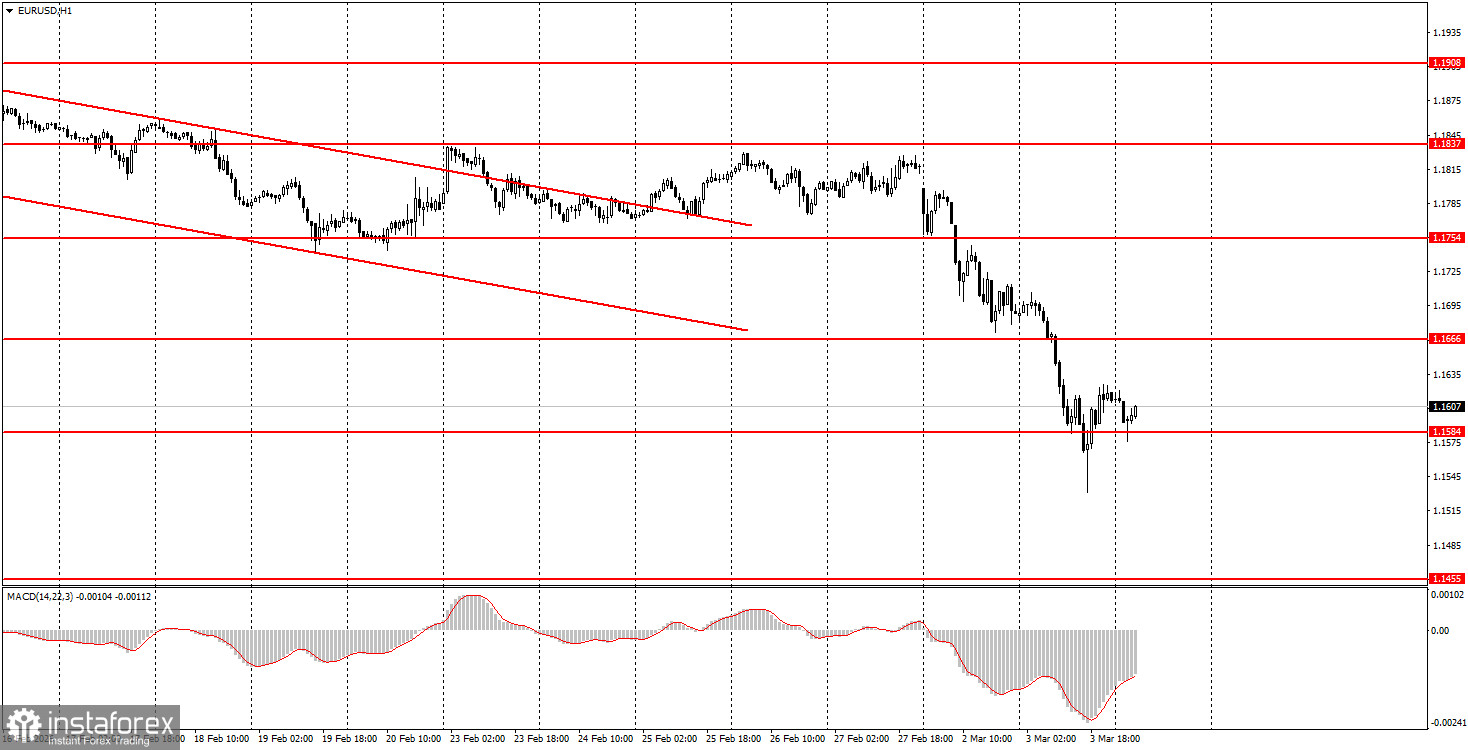
On the hourly timeframe, the downward trend has resumed, but only "thanks" to the new war in the Middle East. At the beginning of 2026, a long-term upward trend resumed, so we expect a new medium-term growth phase for the euro. The overall fundamental background remains very challenging for the US currency, so we fully support further upward movement. However, the market's current focus is geopolitics, not the economy.
On Wednesday, beginner traders may consider short positions if the price consolidates below the 1.1584-1.1591 area, with a target of 1.1527-1.1531. A bounce off the area of 1.1584-1.1591 will allow for opening long positions with a target of 1.1655-1.1666.
On the 5-minute timeframe, levels to consider are 1.1455-1.1474, 1.1527-1.1531, 1.1550, 1.1584-1.1591, 1.1655-1.1666, 1.1745-1.1754, 1.1830-1.1837, 1.1899-1.1908, 1.1970-1.1988, 1.2044-1.2056, and 1.2092-1.2104. On Wednesday, significant events in the Eurozone include the unemployment rate, while in the US, the ISM index for the services sector and the ADP employment change report will be published. The US reports are more important.
Price levels of support and resistance are levels that serve as targets when opening buys or sells. Take Profit levels can be placed around them.
Red lines represent channels or trend lines that show the current trend and indicate the direction in which it is preferable to trade now.
The MACD indicator (14,22,3) – the histogram and the signal line – is a supporting indicator that can also be used as a source of signals.
Important speeches and reports (always included in the news calendar) can significantly affect the movement of the currency pair. Therefore, during their release, trading should be done with utmost caution, or traders should exit the market to avoid sharp price reversals against the previous movement.
Beginning traders in the forex market should remember that not every trade can be profitable. Developing a clear strategy and effective money management are the keys to long-term trading success.
*The market analysis posted here is meant to increase your awareness, but not to give instructions to make a trade.
InstaSpot analytical reviews will make you fully aware of market trends! Being an InstaSpot client, you are provided with a large number of free services for efficient trading.


