


Our team has over 7,000,000 traders!
Every day we work together to improve trading. We get high results and move forward.
Recognition by millions of traders all over the world is the best appreciation of our work! You made your choice and we will do everything it takes to meet your expectations!
We are a great team together!
InstaSpot. Proud to work for you!


Actor, UFC 6 tournament champion and a true hero!
The man who made himself. The man that goes our way.
The secret behind Taktarov's success is constant movement towards the goal.
Reveal all the sides of your talent!
Discover, try, fail - but never stop!
InstaSpot. Your success story starts here!

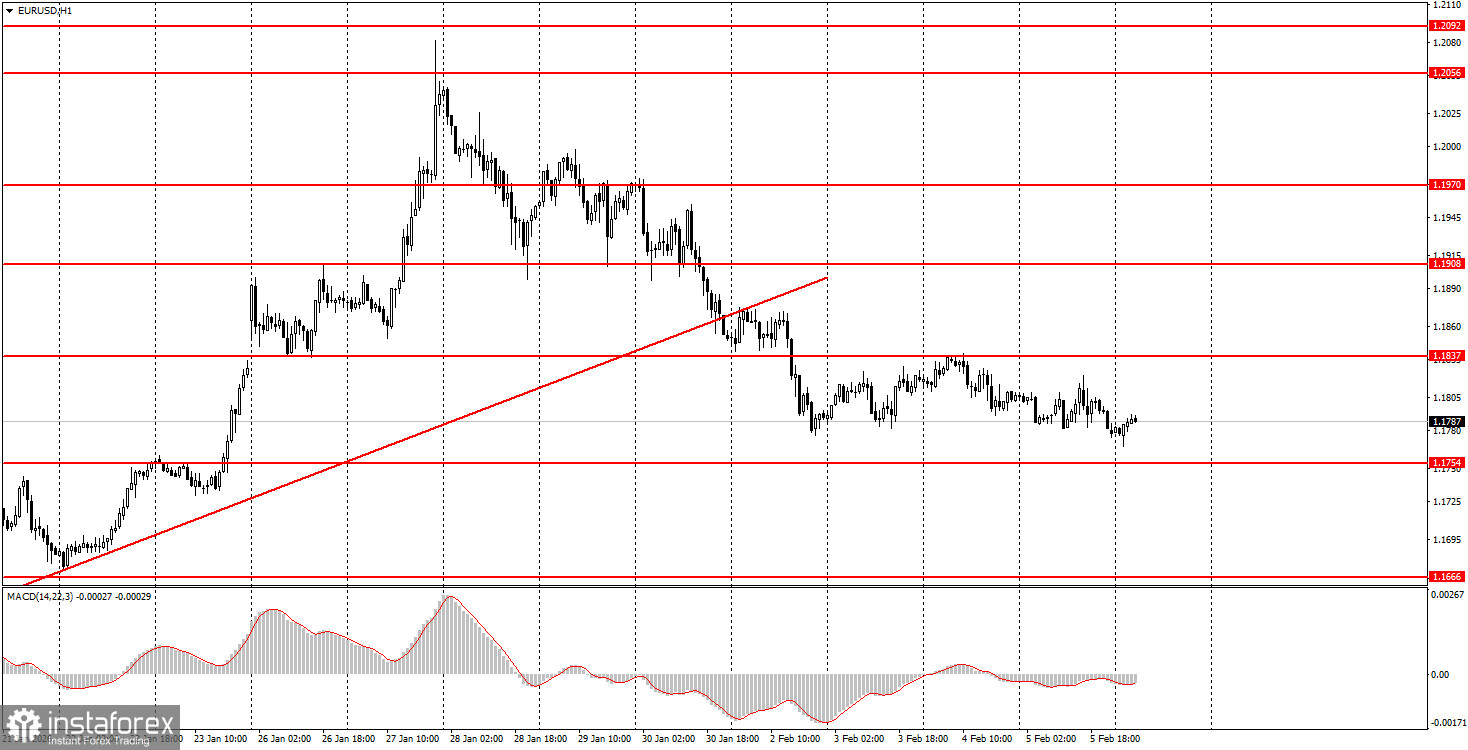
The EUR/USD currency pair found absolutely no grounds for active movements on Thursday. Overall, we agree with the market's price action yesterday, as there was indeed nothing for traders to react to throughout the day. As we warned, the first European Central Bank meeting of the new year was a formality. The ECB had no reason to change rates at the beginning of February. Yes, inflation in the Eurozone slowed to 1.7%, but this was known a day before the meeting. 1.7% is, of course, lower than the 2% target the ECB aims for, but inflation cannot be exactly 2% every single month. What matters is the average or median value over six months or a year. In general, if the ECB decides to ease monetary policy again, it will not be in the near future, as Christine Lagarde practically stated openly. For the ECB to resume rate cuts, inflation must remain below 2% for a sustained period.
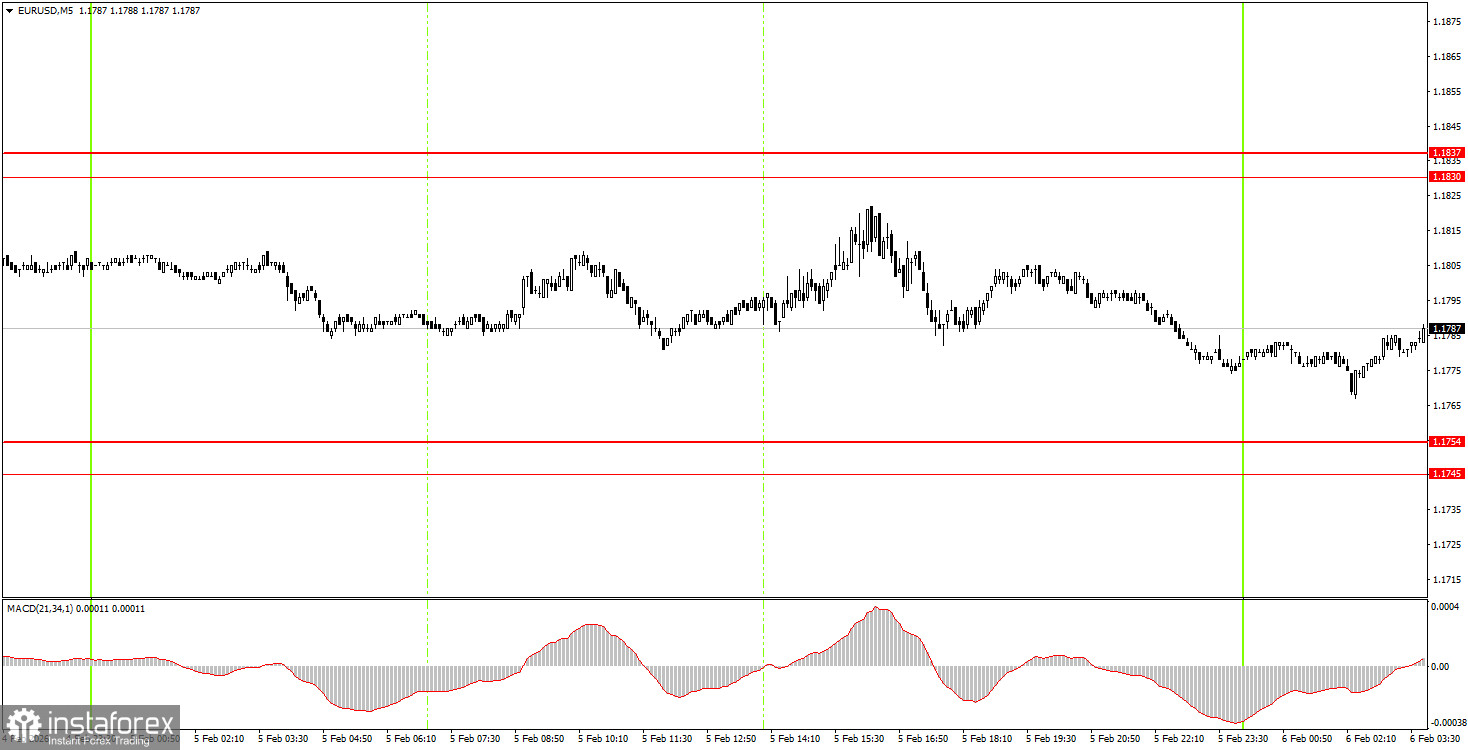
On the 5-minute timeframe, no trading signals were formed on Thursday. Volatility throughout the day was very weak, and prices did not even approach significant areas and levels. Thus, beginner traders had no grounds to open positions on Thursday.
The hourly timeframe continues the downward correction, which can be considered a local trend. Let us remind you that the flat phase, which lasted for seven months, has ended. If this is the case, the long-term upward trend has resumed at the beginning of 2026. Therefore, we anticipate a new medium-term decline in the dollar. The fundamental backdrop remains very challenging for the U.S. currency, which fully supports further upward movement.
On Friday, beginner traders may consider new short positions if the price consolidates below the 1.1745-1.1754 area, with a target of 1.1655-1.1666. A price bounce from the area of 1.1745-1.1754 will allow for opening longs with a target of 1.1830-1.1837.
On the 5-minute timeframe, the following levels should be considered: 1.1354-1.1363, 1.1413, 1.1455-1.1474, 1.1527-1.1531, 1.1550, 1.1584-1.1591, 1.1655-1.1666, 1.1745-1.1754, 1.1830-1.1837, 1.1908, 1.1970-1.1988, 1.2044-1.2056, 1.2092-1.2104. Today, in the Eurozone, attention is focused only on Germany's industrial production report. At the same time, the University of Michigan's consumer sentiment index will be published. Neither report is crucial, so throughout the day, weak movements close to a flat may be observed again.
*The market analysis posted here is meant to increase your awareness, but not to give instructions to make a trade.
InstaSpot analytical reviews will make you fully aware of market trends! Being an InstaSpot client, you are provided with a large number of free services for efficient trading.


